Factorial's new reporting tool
We designed, built and launched an evolution of our reporting tool based on fully scalable and adaptable Business Intelligence. With a new engine, a new SQL Editor, and a new Dashboard Manager, we took the use of reports to a whole new level.
We designed, built and launched an evolution of Factorial's Reporting tool to cover any need that may arise for our customers. Based on fully scalable and adaptable Business Intelligence, we built a new reporting engine that can calculate any type of operation. With the new engine, the new SQL Editor, and the new Dashboard Manager, we are able to take the use of reports to a whole new level.
1. Context
Factorial is the software that helps companies to manage everything that a company needs to manage in one centralized system; saving time, eliminating mistakes and helping companies to make decisions.
Reports is a key domain to help our customers to make better decisions based on real data about their workforce and their business.
What is a report?
A report is a visual representation of data or information.
Our previous Reports’ dashboard allowed customers to build custom reports with a UI-centric query builder or choose from a gallery of pre-built reports. In Factorial, customers can use any data in their accounts to create reports with different visualizations, share them, and download them.
But many customers complained that this query-builder did not provide them with all the options they needed to generate the reports they wanted. And tickets, customer complaints and account manager requests were piling up in Hubspot and Canny.
2. Problem
The usage ratio of Reports is dropping for no apparent reason, as the functionality has not changed drastically but it is obvious that less and less companies, in proportion, are using our feature. Churn and churn risk were going up and we were losing a lot of deals because of this tool. All metrics were absolutely negative.
Our reporting tool was not able to generate the reports our customers needed.
In back-end and business intelligence terms we have several problems with our current Reports implementation. The most important ones can be summarized as following:
- Hard to scale data from business logic
- Time sensible data is hard to be handled by just MySQL
- Silos
- Permission-less engine
- Duplicity of implementation
- Complexity
All these problems are translated in a lack of effectiveness of teams when it comes to expose Factorial information from the app's several domains to the reports engine.
3. Discovery
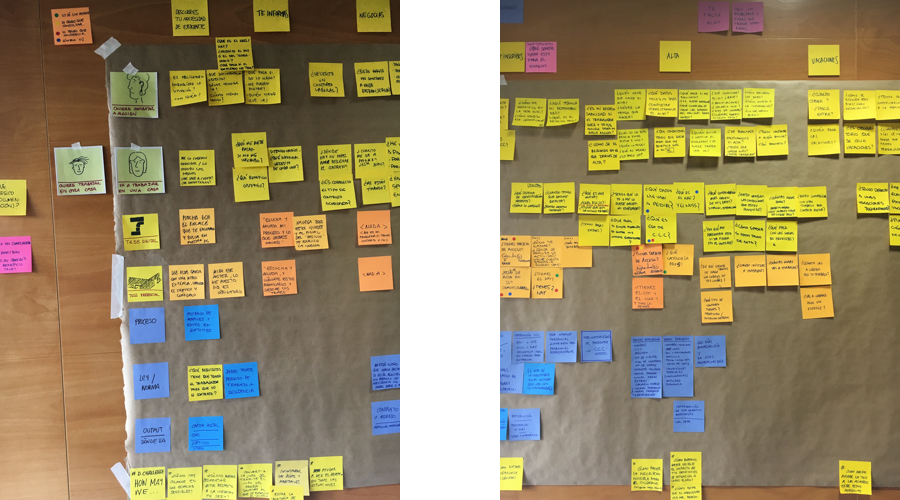
We talked to 30 of our customers to understand what they needed and what was their problem that we were unable to solve and we came to the conclusion that it was not our feature that had changed but our customers themselves. And, of course, their needs.
We conducted 30 interviews and online surveys involving over 200 customers. I developed empathy maps to pinpoint user needs, frustrations, and goals associated with reports. Additionally, I crafted detailed journey maps illustrating user experiences during interactions with reports. These maps identified key touchpoints and the corresponding emotions, tailored to the diverse user personas present at Factorial.
At the beginning, our target company and most of our customers were SMEs, with very specific, very basic needs, which our tool fulfilled without any problem. But as time went by, as is normal, we started to target larger companies, with many more employees and much more complex use cases. All our new customers had this profile and for all our new customers our Reports tool did not meet their basic needs because they needed to squeeze their data in a more intensive way and we were not able to help them.
Use cases
- A external bookeeper wants to be able to use reports to download payroll flows and information from a specific group they manage.
- A manager who is in charge of the time tracking of their employees want to be able to have access to the time tracking reports and have that info in XLS.
- A director of a subdivision who wants to be able to make reports for the people reporting to them. We cannot give them admin privileges to the whole company.
- Some managers that help admins need to have access for almost all app but private and specific info of employees (i.e. salaries).
- Some members of the team that are not admins need access to ATS, performance management app and reports.
- A manager of a team needs to create expenses reports for their employees that report to them.
4. Definition of success
The success criteria for reports is to have all the pieces needed to easily add information to reports in a quick way so finally make it possible to include the reports data for any new feature in the same epic and also increase maintainability.
- To get any reports needed in all the use cases listed above to be generated.
- To create any report that could previously be generated in 75% less time.
- To create any exposer needed from any domain in less than 2 hours.
5. Solution
Our first idea was to improve the query-builder, that tool with a very visual UI focused mainly on HR Managers or Team Leaders. But we soon discarded it because we were aware that this UI not only did not scale but it was absolutely impossible to use all the data that Factorial collected using a report builder tool. We could improve, no doubt, but in the medium term we would have the same problem again.
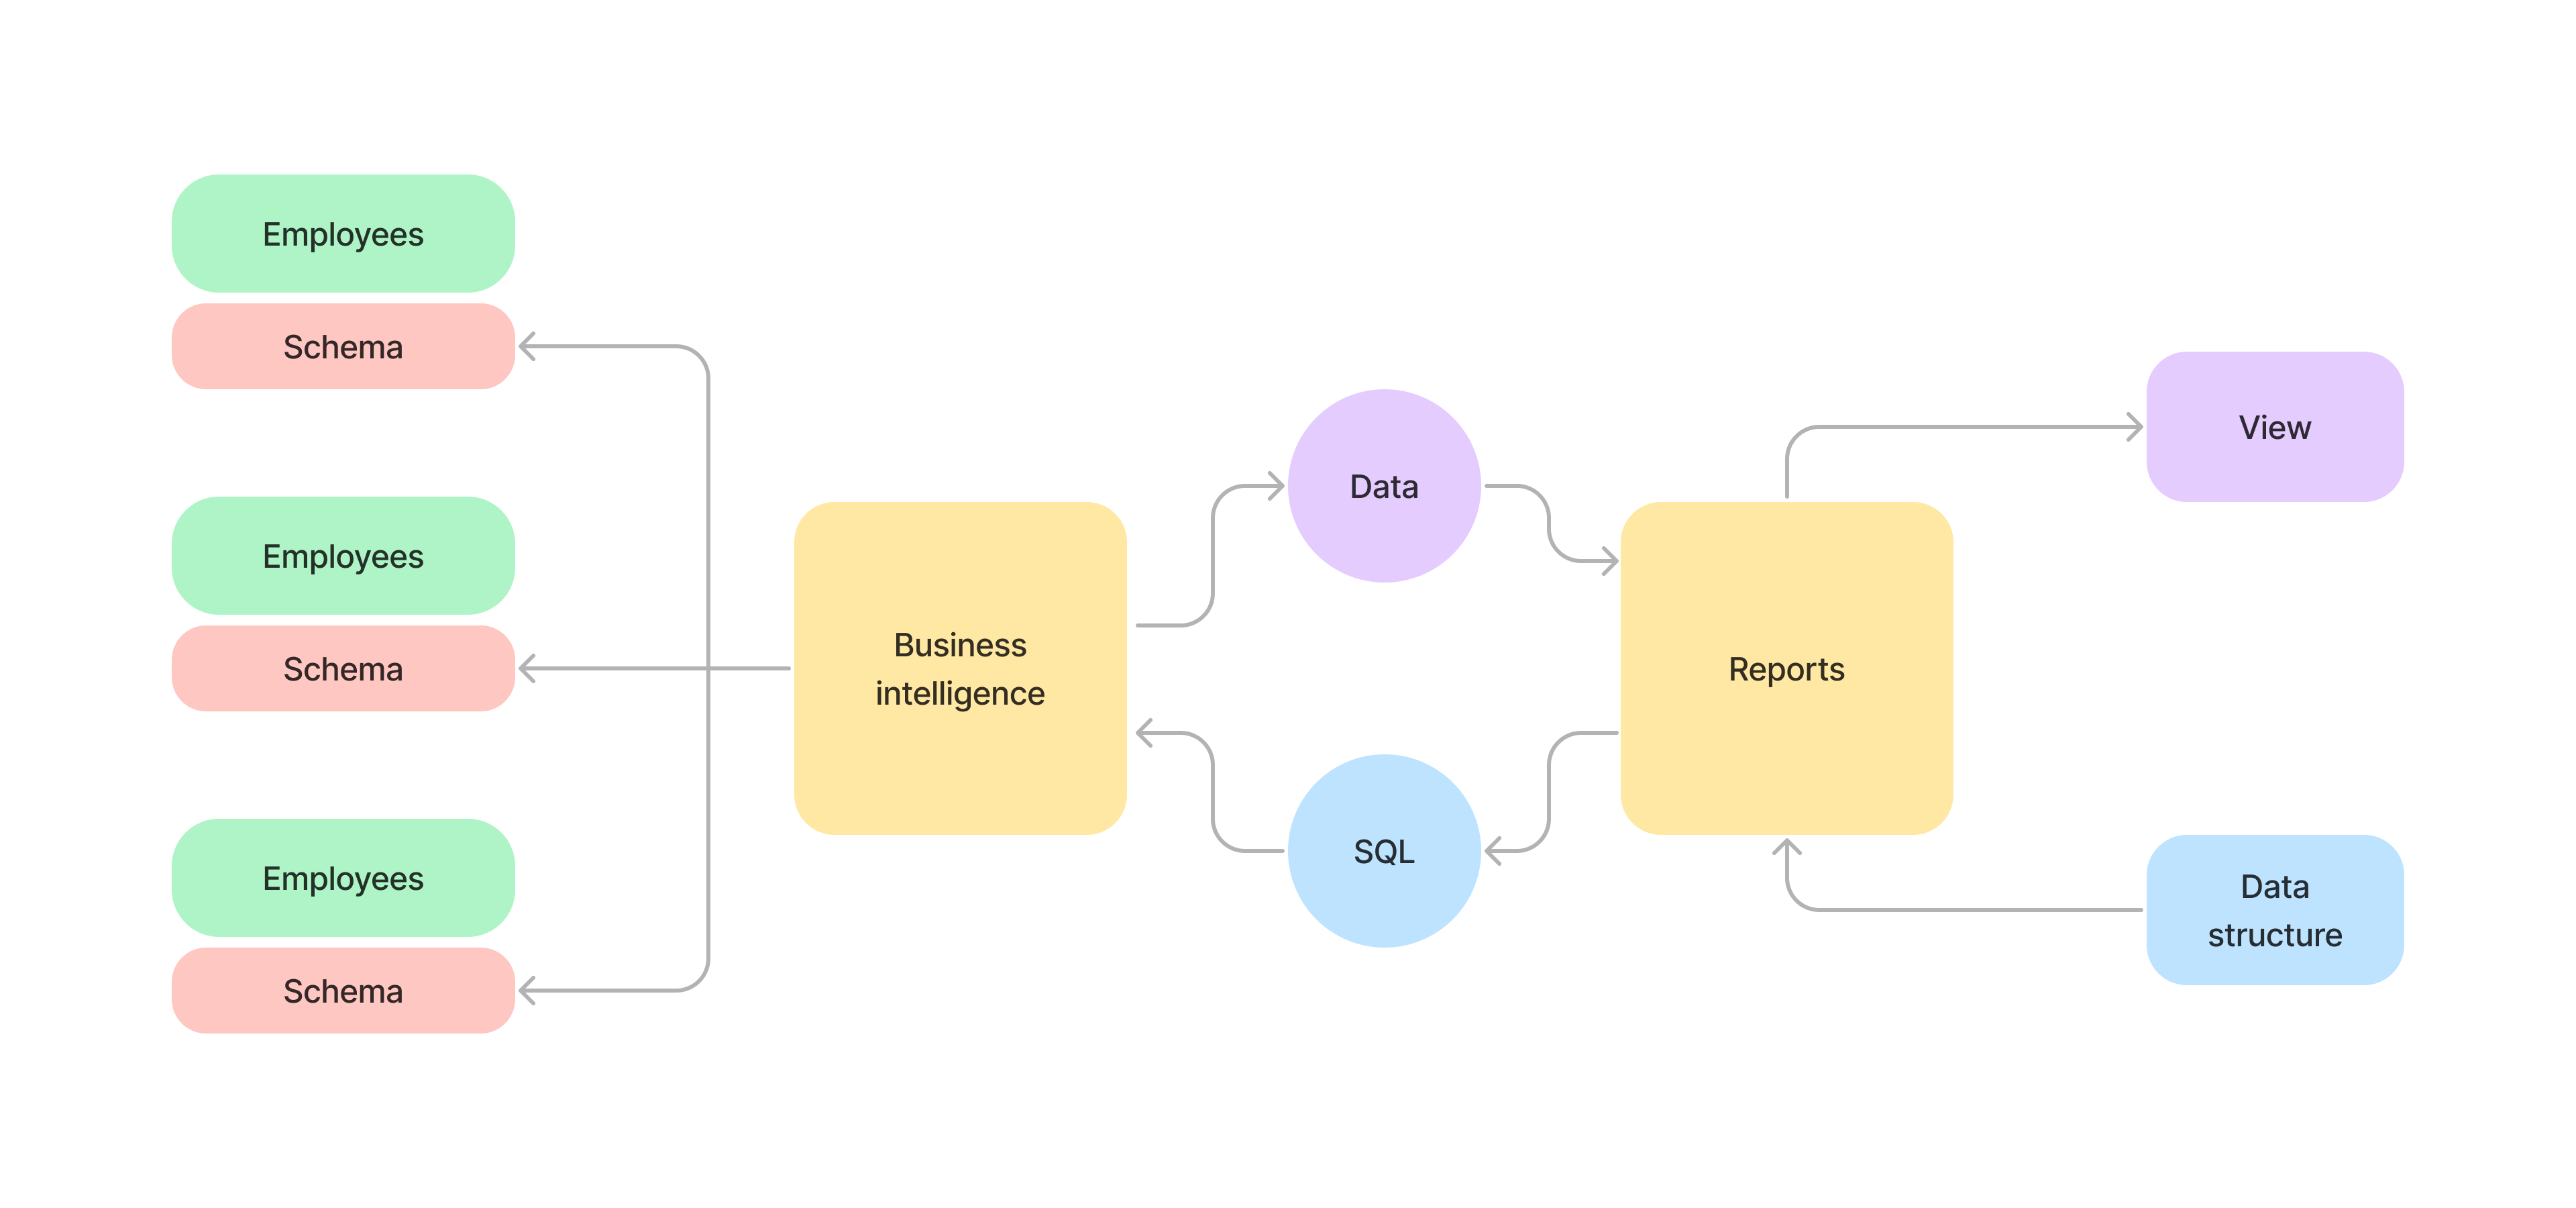
Finally we launched an evolution of our Reporting tool that will cover any need that may arise for our customers. Based on a fully scalable and adaptable Business Intelligence, we designed and built a new reporting engine that calculates any type of operation regardless of complexity. We are able to take the use of reports to a whole new level with the new engine, the new SQL Editor, and the new Dashboard Manager.
New engine
It will be possible to connect all Factorial data stored by a company with the new reporting engine. Being able to generate accurate reports on absence, timekeeping, recruitment, expenses, and performance. This new functionality allows us to generate reports such as:
- Absences by hours and absence types.
- Evolution of expenses per employee over time.
- History of salaries and contracts.
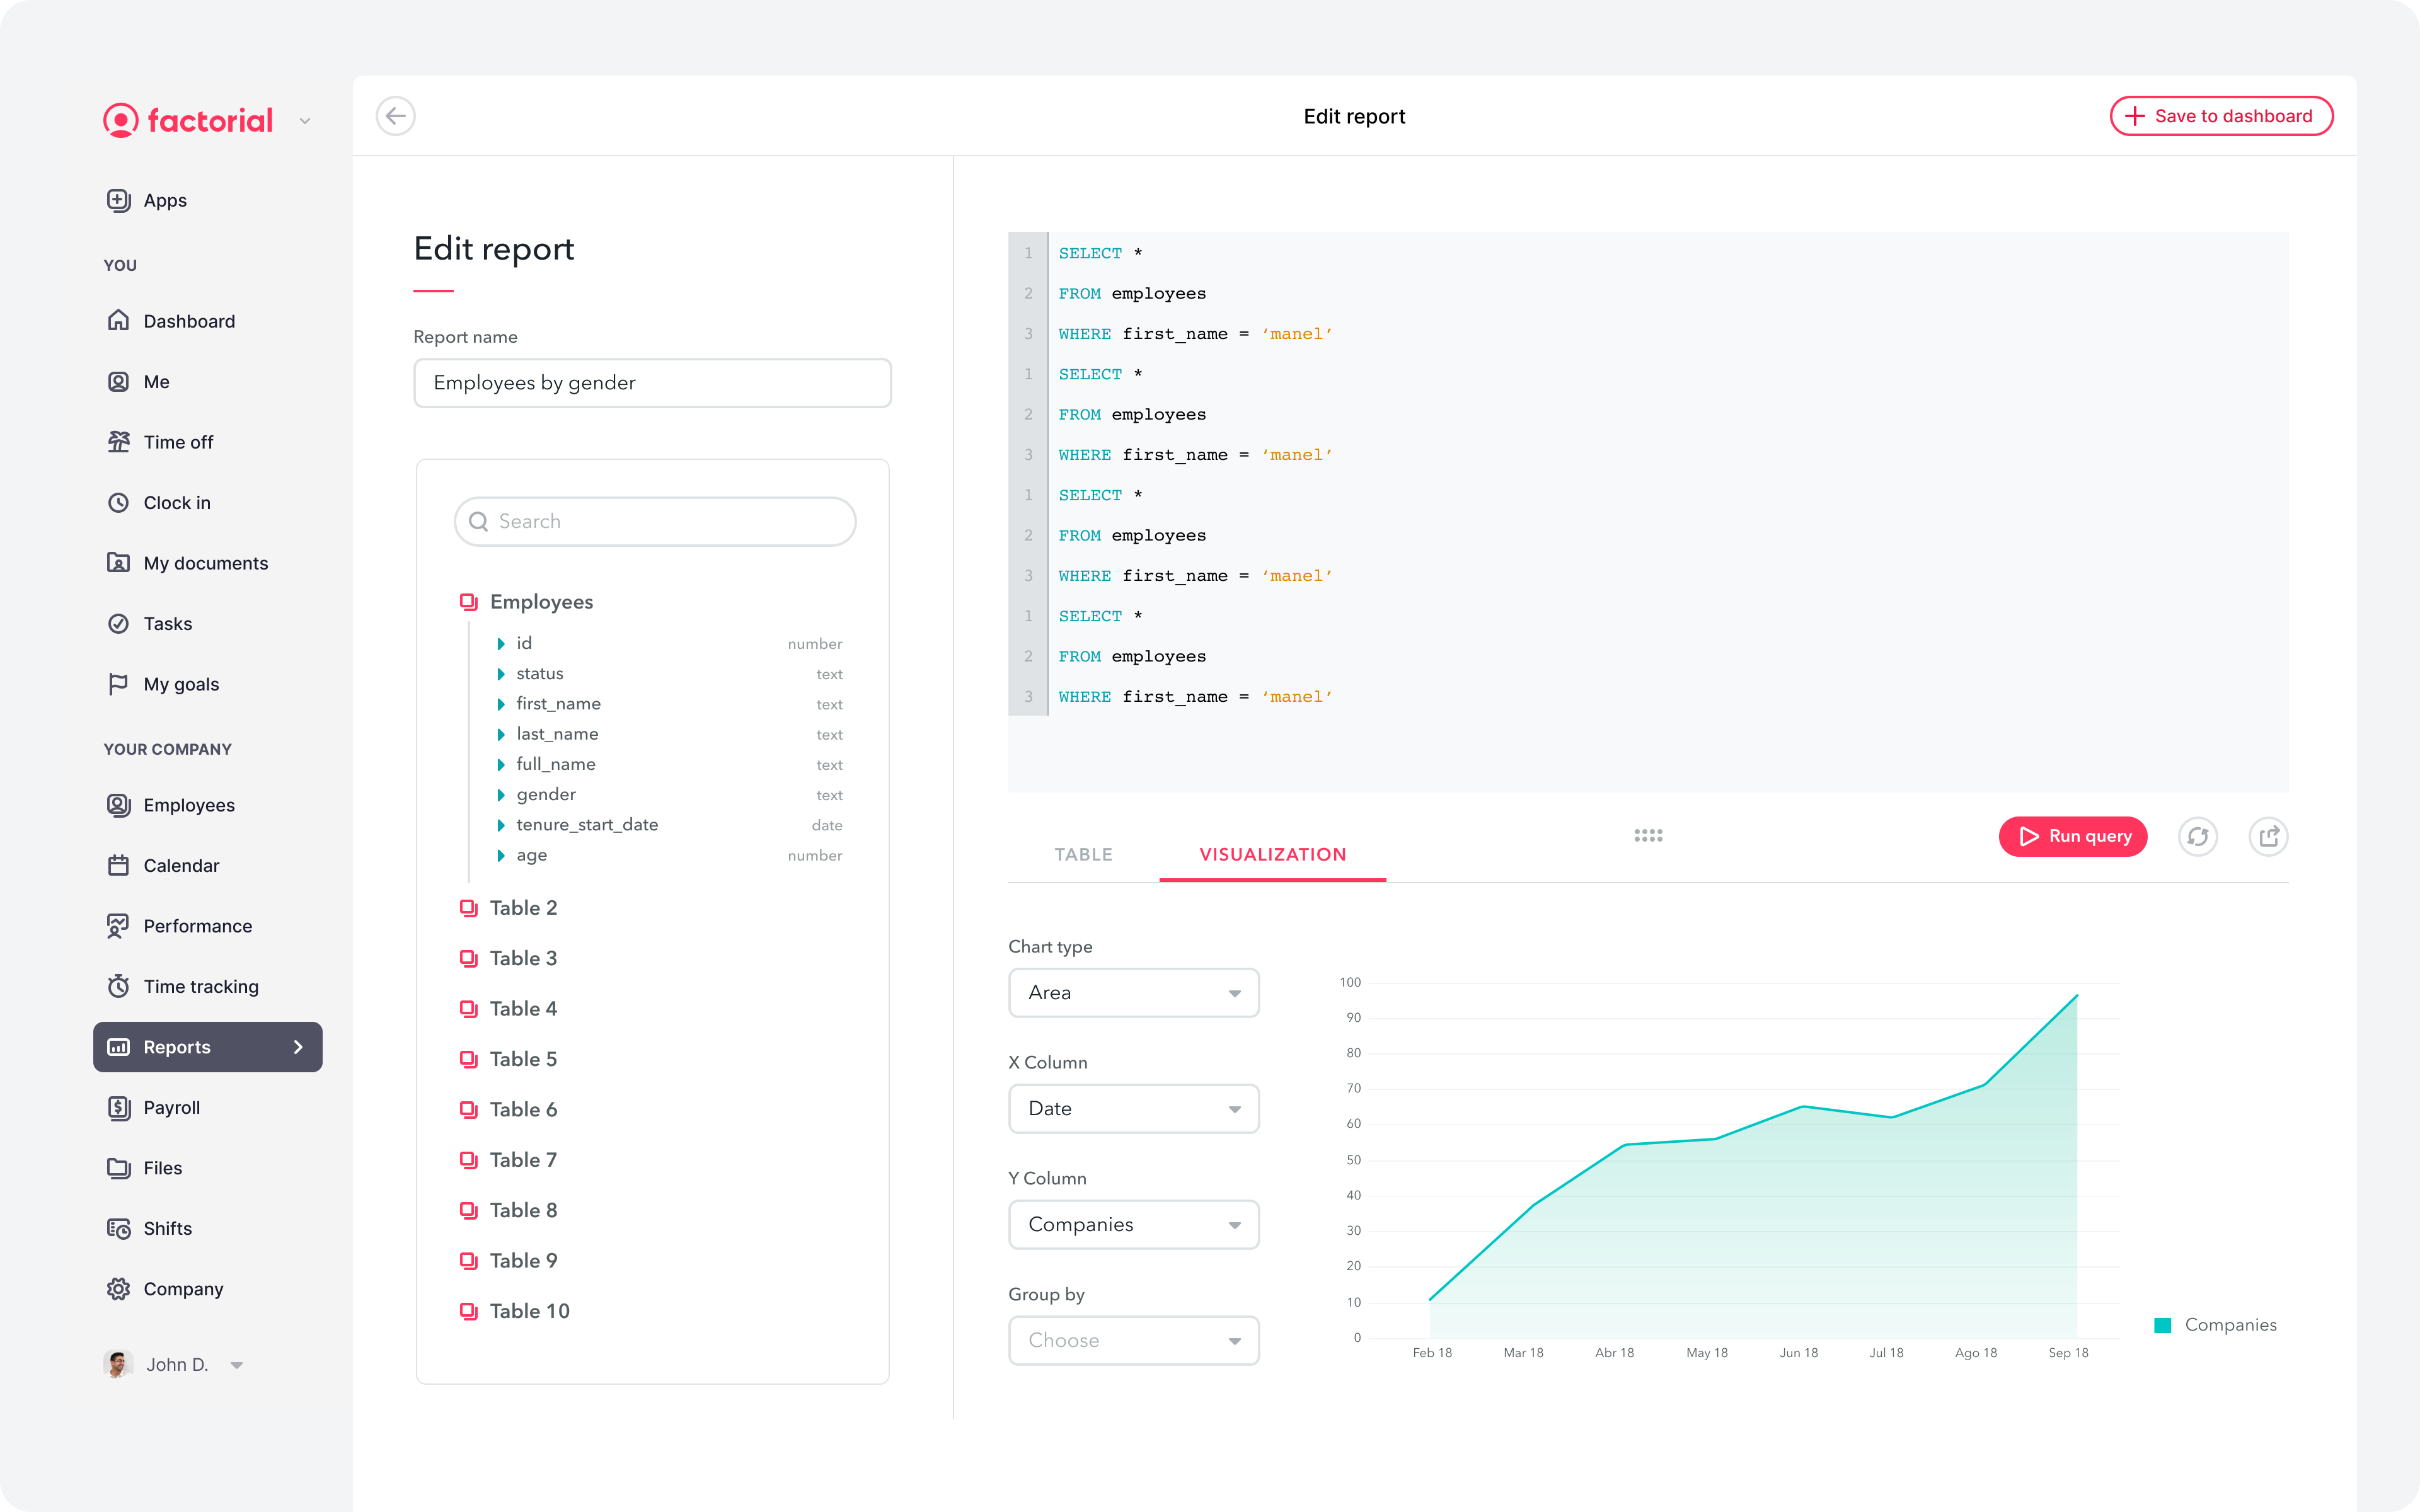
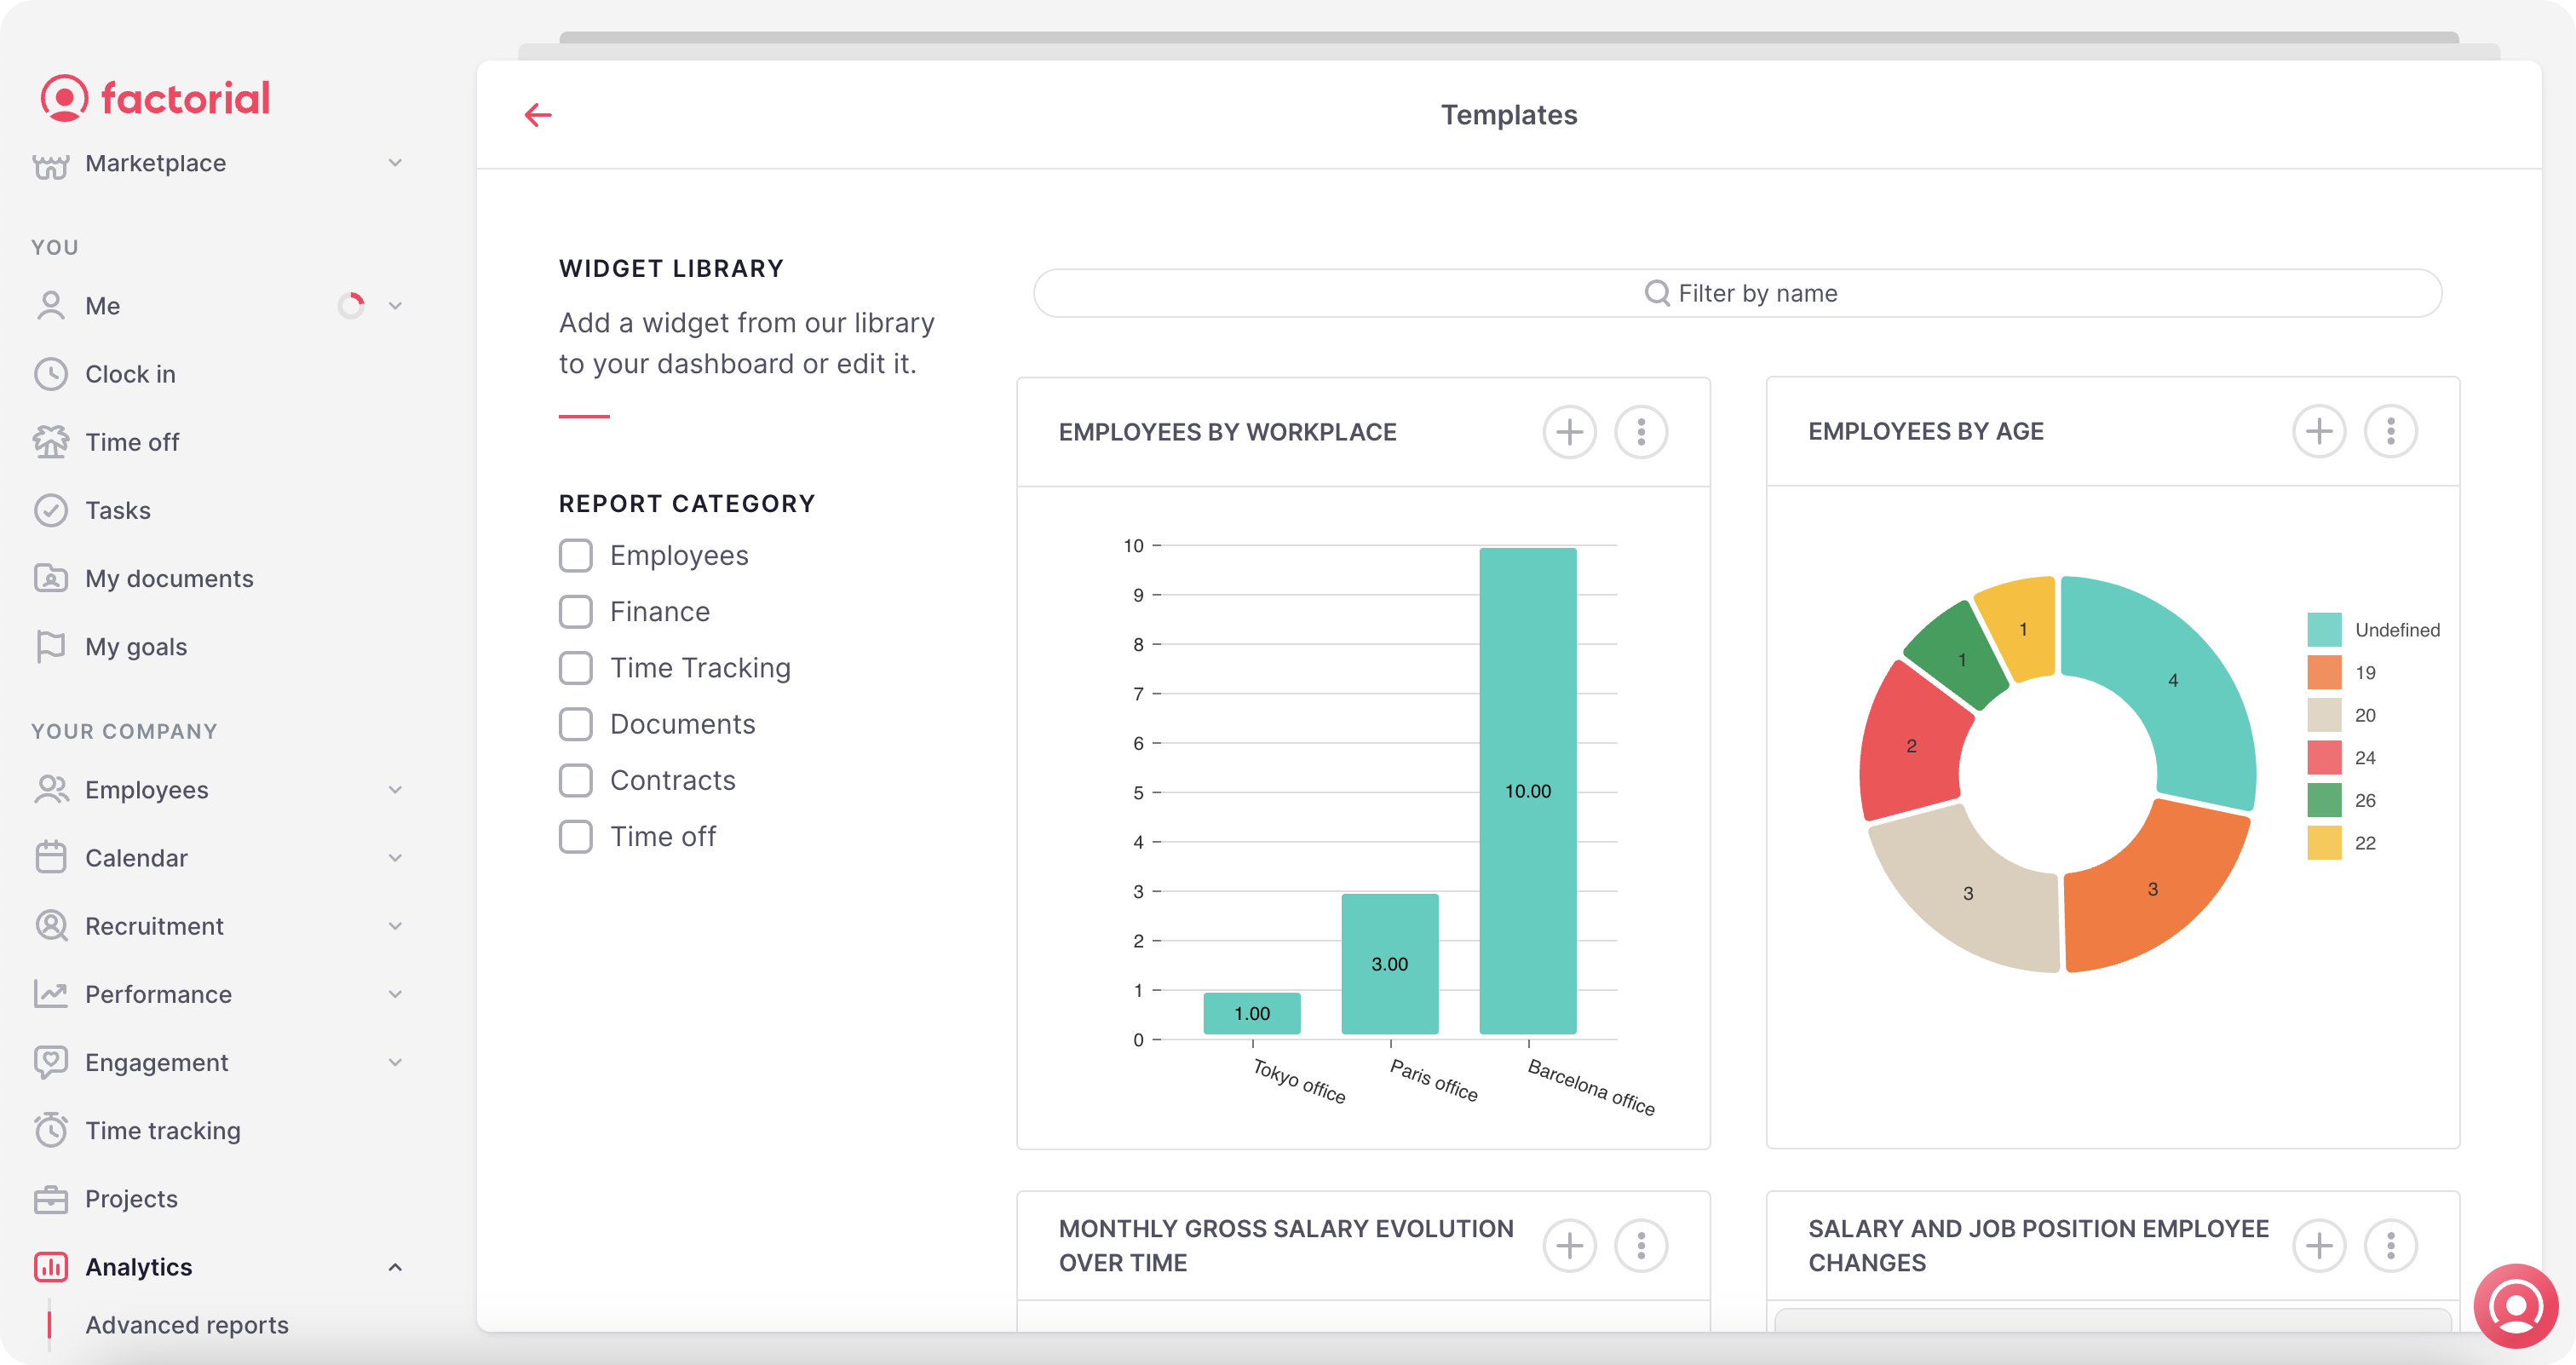
SQL editor
So, taking into account that a very high number of our new companies had Data Analysts or similar profiles as employees, we came to the conclusion that the best and most scalable way to take advantage of our datalake was through SQL.
The new SQL Editor functionality is specially designed to cover all the blind spots of the report generator and with it the customer will be able to cross tables and calculate by means of formulas extremely complex operations to extract information from different sources and thus generate reports that until now were not possible, such as:
- Absenteeism rates.
- Total hours worked by a team compared to total hours planned per month.
- Hours and overtime clocked in, by day, month or week.
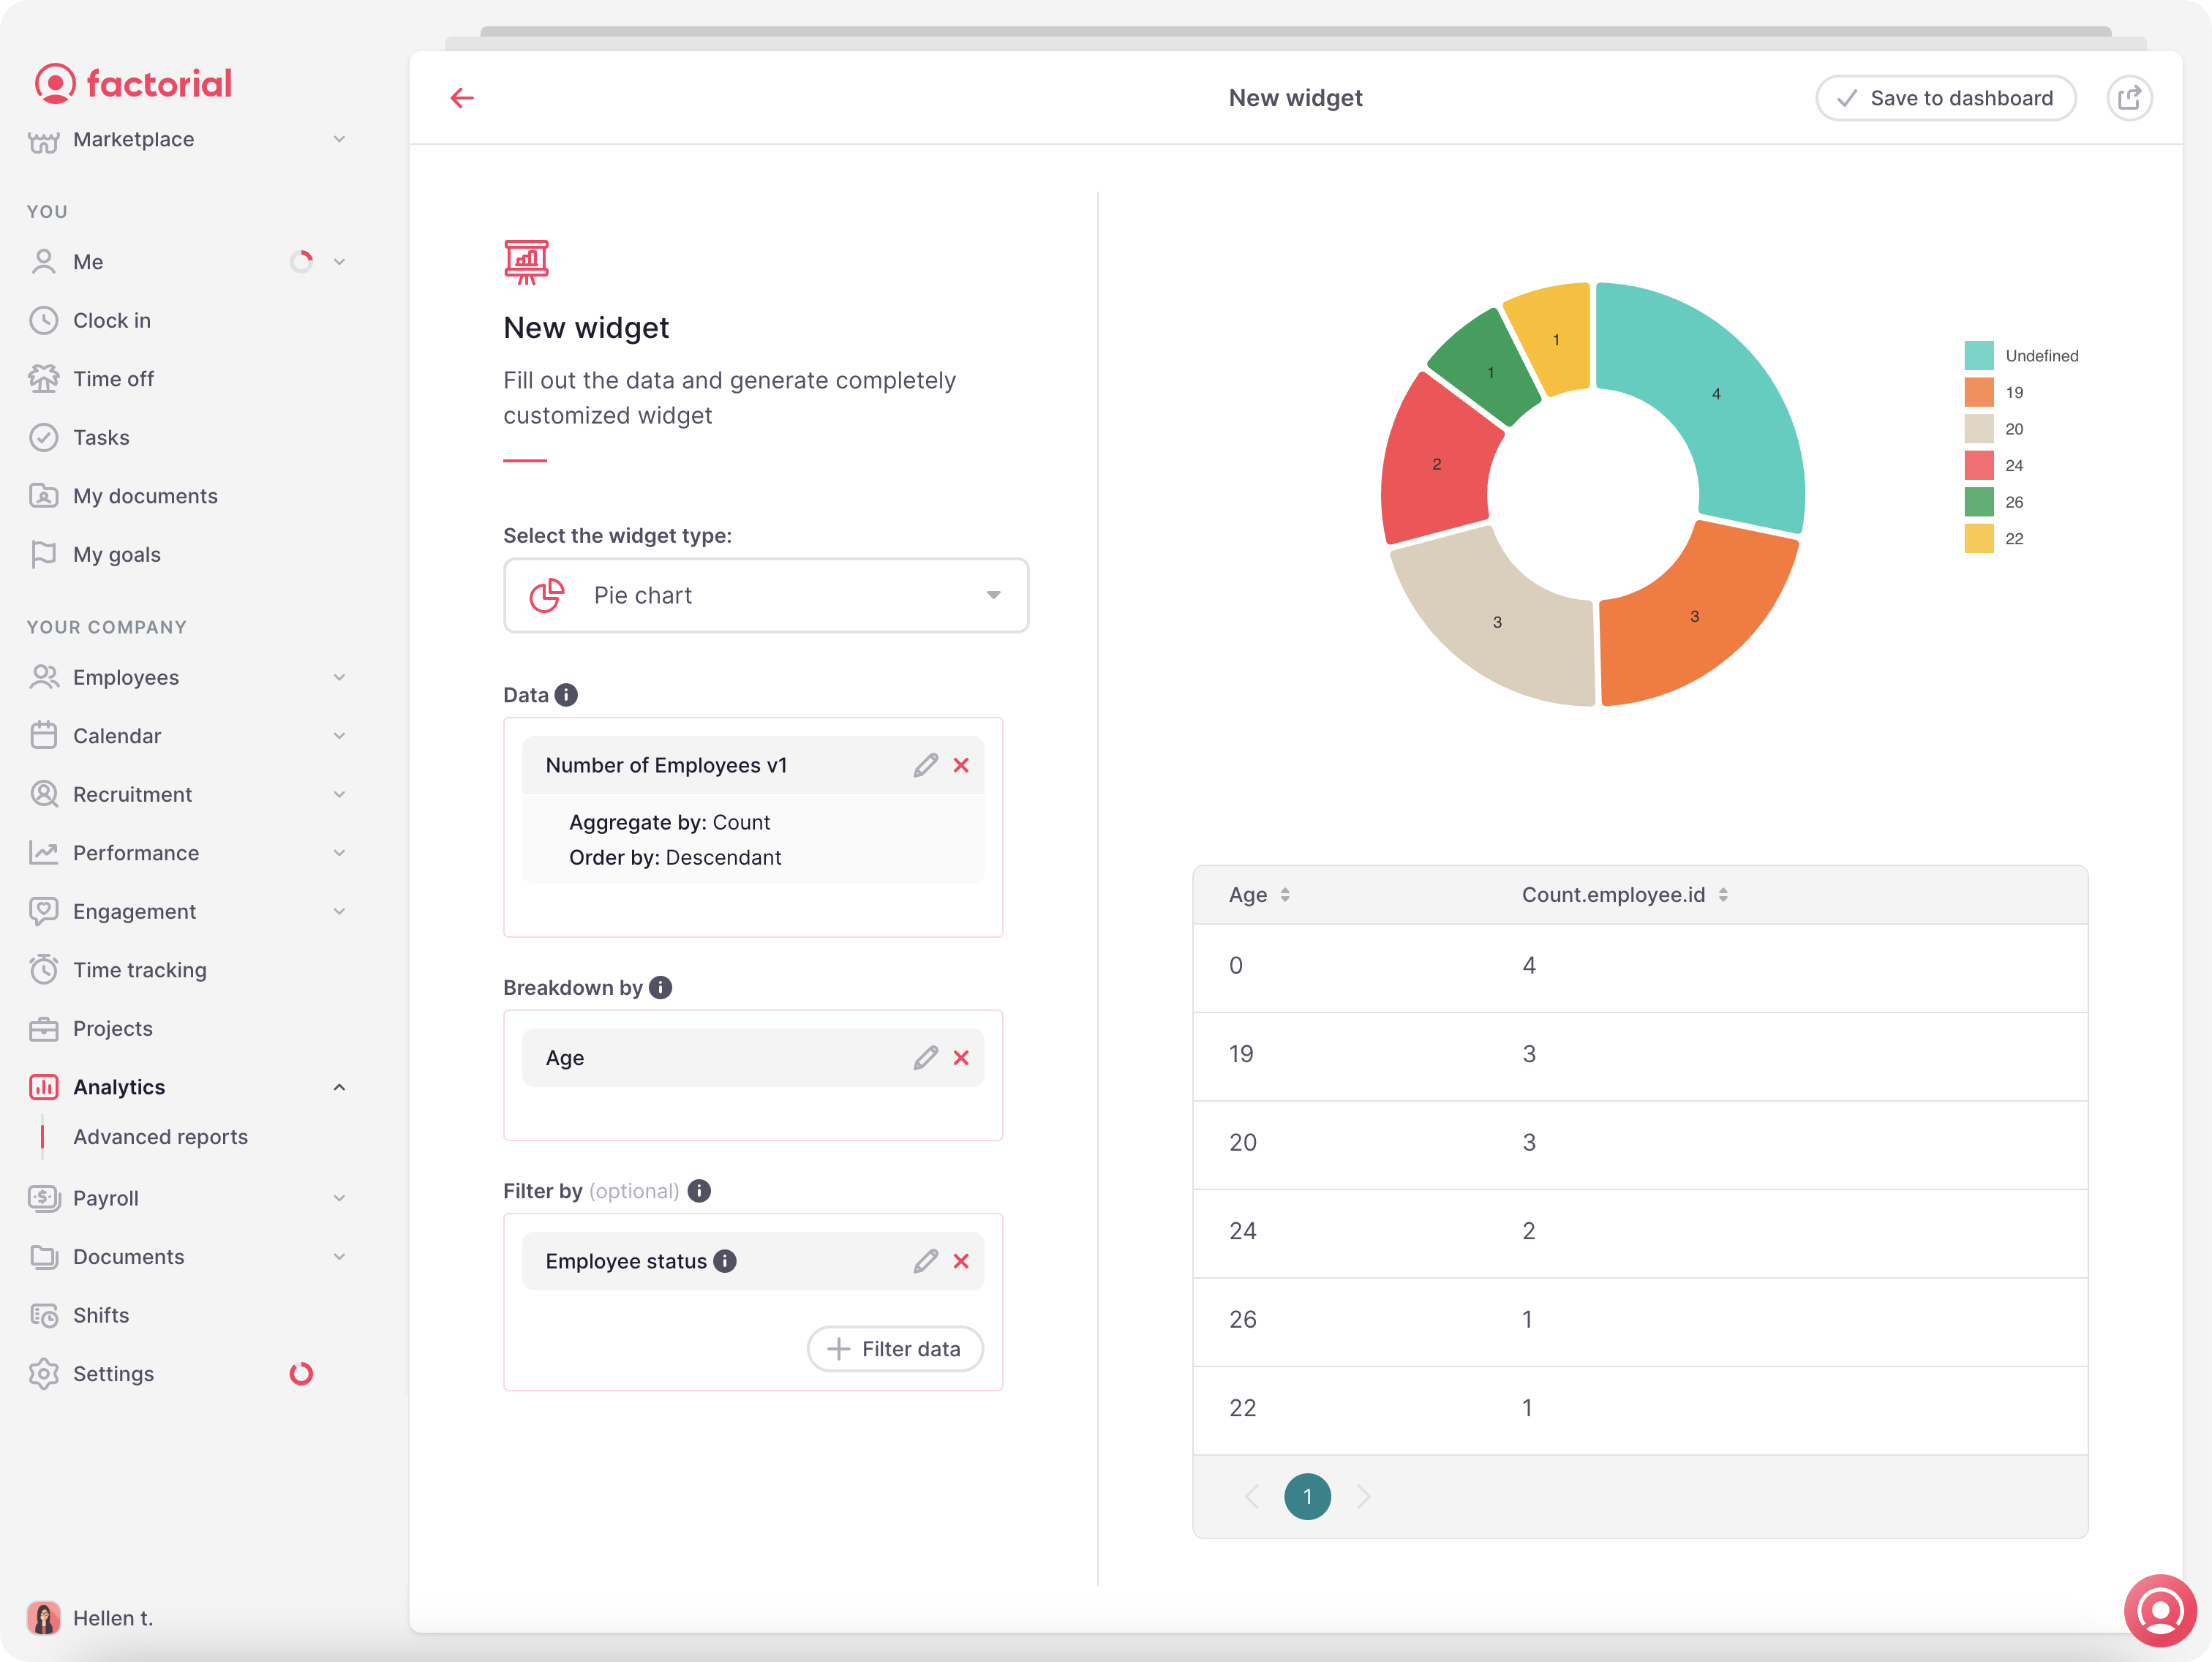
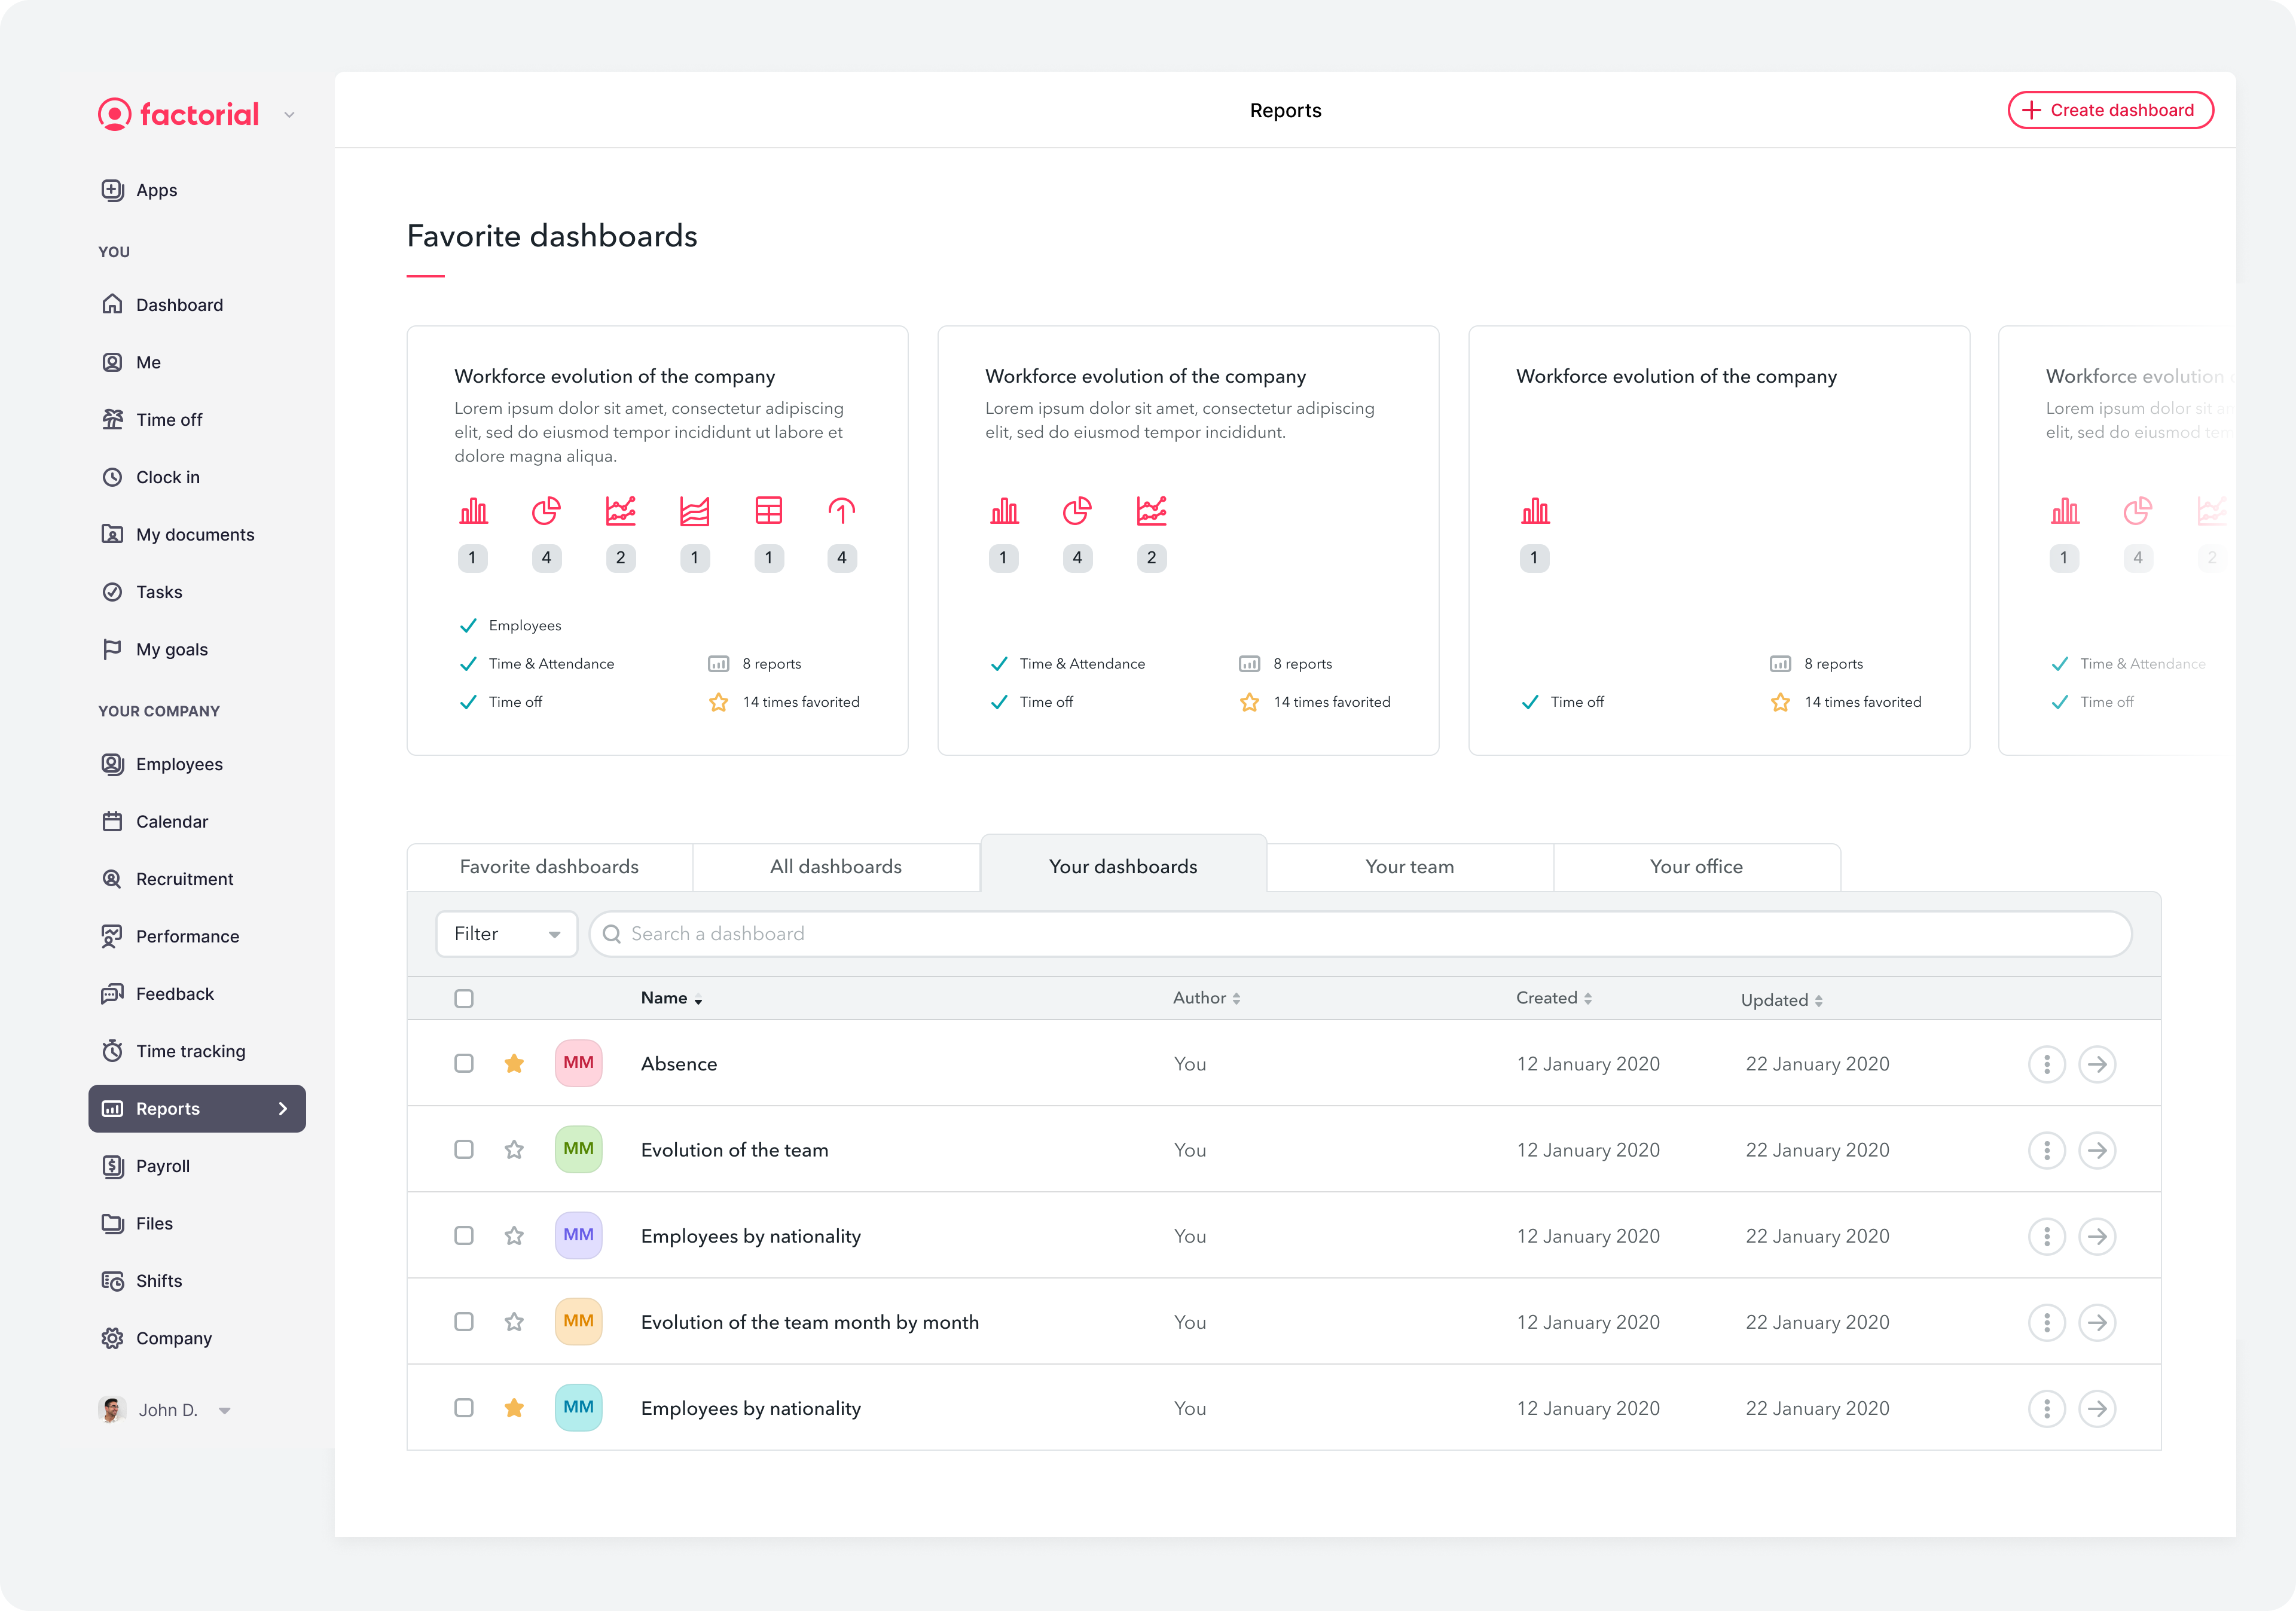
New dashboard manager
The new version of the Dashboard Manager is aimed at the use of Reports by all employees of the company, allowing any employee (with the corresponding permission) to create their own dashboards, generate reports and be able to share them by restricting their visibility to other groups of employees such as offices, teams or customized groups of employees. In this way, we will be able to:
- Create dashboards and reports exclusive to a team or team manager.
- Restrict the view or editing of a report to a specific group of employees.
- Designate panels as individual favorites for more efficient management.
6. Design challenges
Broad audience
One of the objectives of this initiative was to democratize Reports and open them up to all employees of our clients. This made our audience very wide so we had to design for the CEO of a company with 1000 employees but also for an employee with no reports at all. This can mean reports with a huge load of information but also simple charts for a mid-manager of a team of 5 people.
I needed to take into account the different types of users and their specific needs in order to cater to a wide range of users with different levels of technical knowledge.
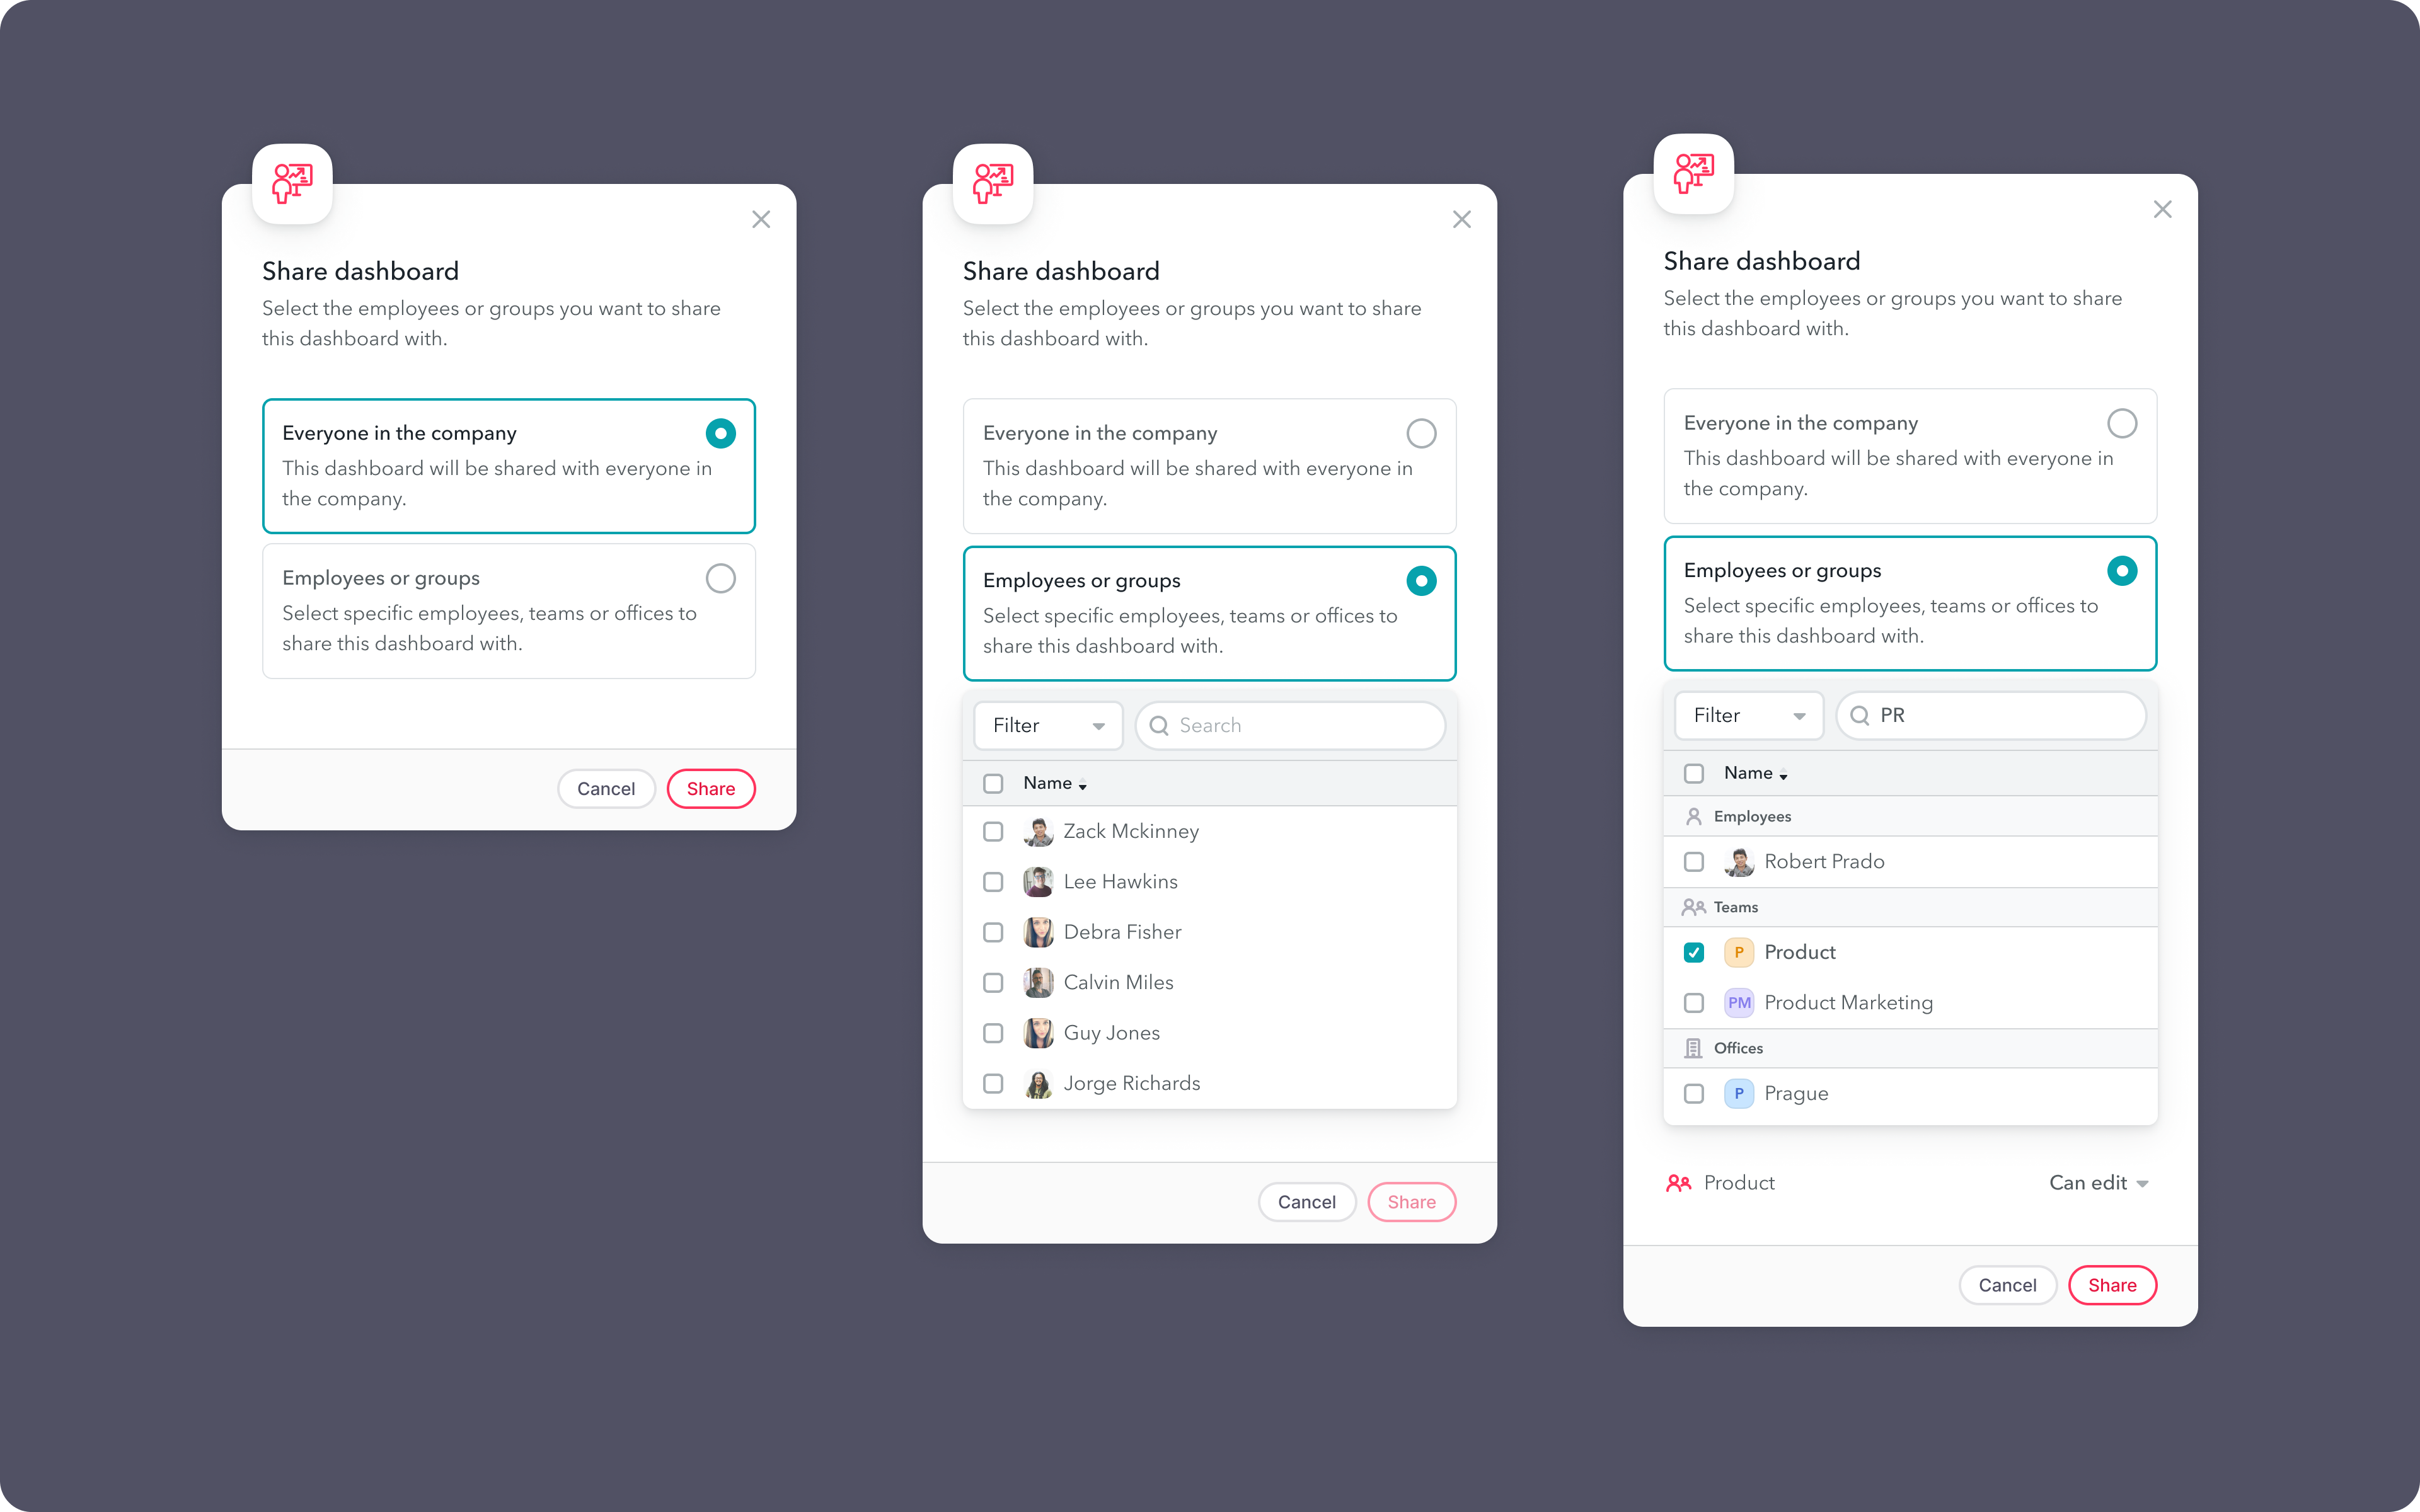
Permissions and access management
Different levels of access and permissions were also crucial. Organizations must control and manage user access based on their roles or departments, but it is also users themselves who manage the viewing and editing permissions within their own reports and dashboards. We had to develop a user interface that would override hard permissions to give dashboard owners complete freedom to share but also allow administrators to assign and revoke user permissions, ensuring that sensitive data remains protected and only accessible to authorized personnel.
Scalability and performance
Enterprise software design must prioritize scalability and performance. Organizations expect their software to handle increasing volumes of data, growing user loads and evolving business requirements.
Designers must incorporate patterns, such as modular design, to ensure that software can scale horizontally and vertically, adapting to future growth without compromising performance. In this way we were able to make the creation process for the new Reports much more fluid and able to effectively address the complex needs of organizations and deliver a seamless user experience.
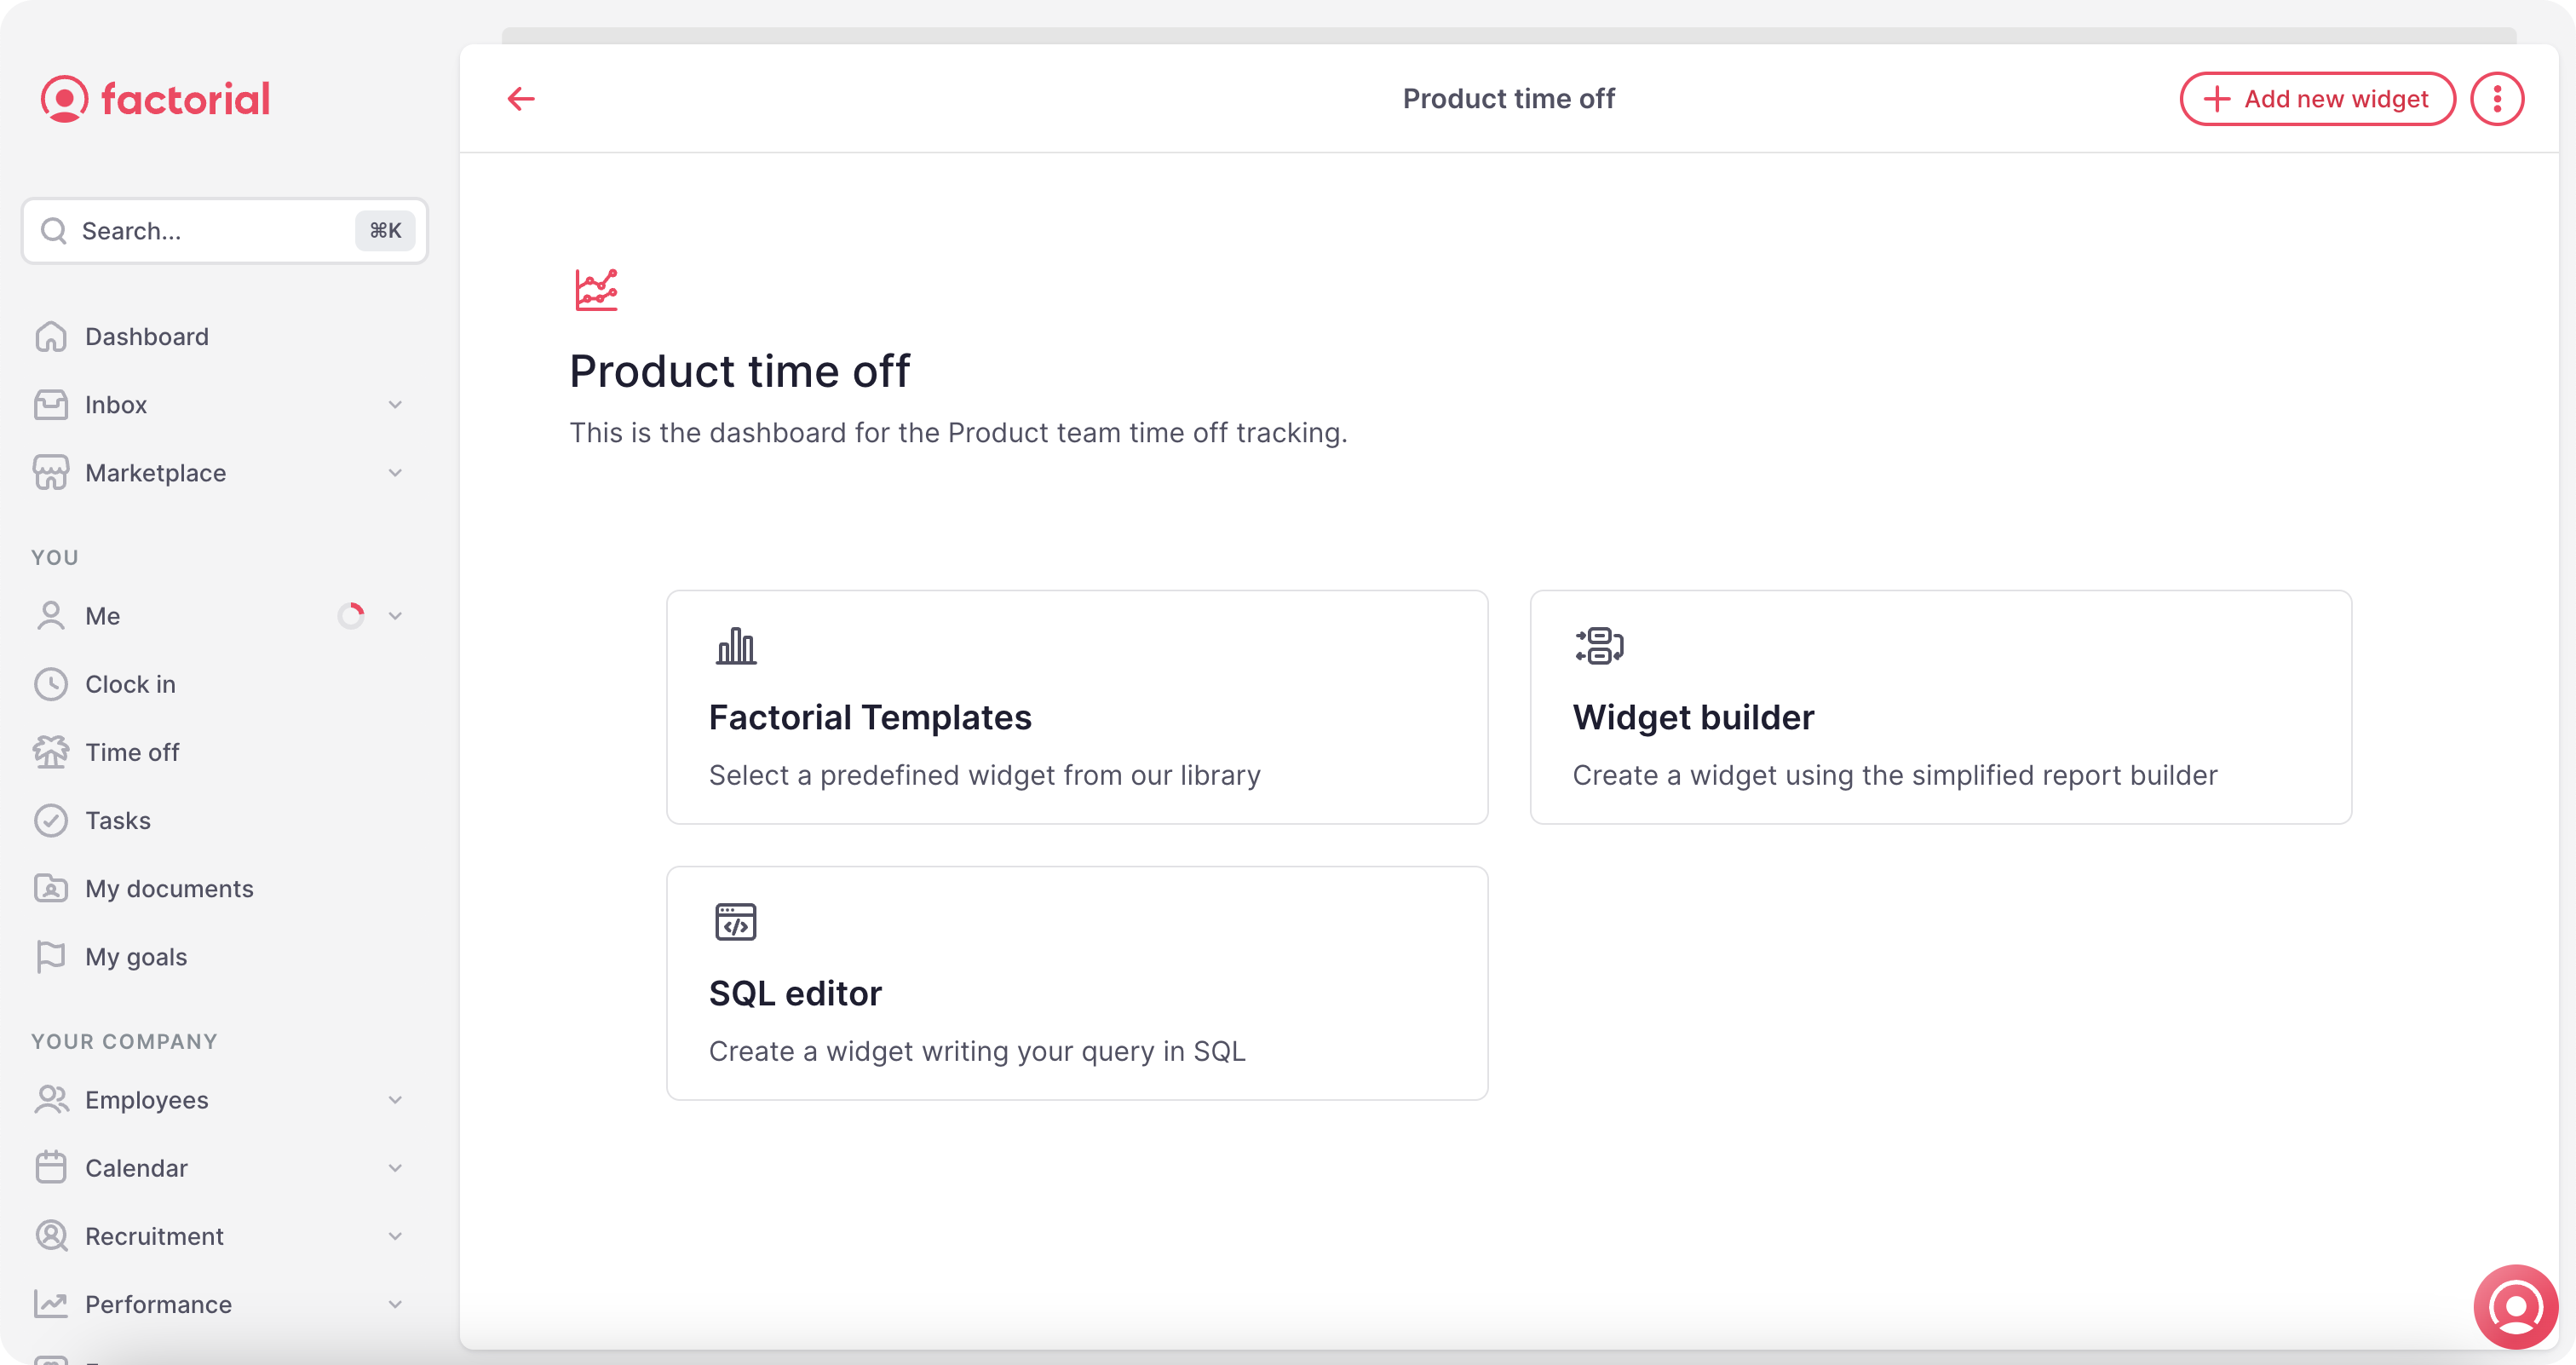
Consistency
Reports already existed before this huge iteration. We had to be consistent both in the interface design and in the different flows that were added to the existing ones. For example, the creation of a report using the SQL editor needed to be integrated with the previous creation experience such as Templates or Widget builder.
It helps users feel comfortable and familiar with the product, reducing confusion and facilitating easy navigation. To achieve UX consistency, we used our design system, patterns, guidelines, and standards across the software.
7. Implementation
Validation
Once we had prototyped our solution we went back to talk to some customers we had talked to previously and we could validate that this way they would be able to generate those reports that right now were impossible to get out. The interface was familiar to SQL users, intuitive and maintained the basic querybuilder that hundreds of companies were still using. In addition, it was a tool that we could use ourselves to build custom reports for our clients in cases of severe churn risk.
Release
This feature was designed and developed in permanent contact with the developers of my team during 6 weeks. We made a soft release in which we opened the feature to 10 customers previously contacted for two weeks, who gave us periodical feedback. After that period of time, we opened the new feature to all our customers.
8. Outcome
With this feature we were able to increase custom report creation by 400%. The usage ratio increased in 12.7 points and we avoided very critical churn cases preventing a churn of 43.422 MRR in the next 3 months. It impacted on our main objetive for that quarter with a Key Result 01: Reduce the churn rate related to Reports to less than 1% monthly.