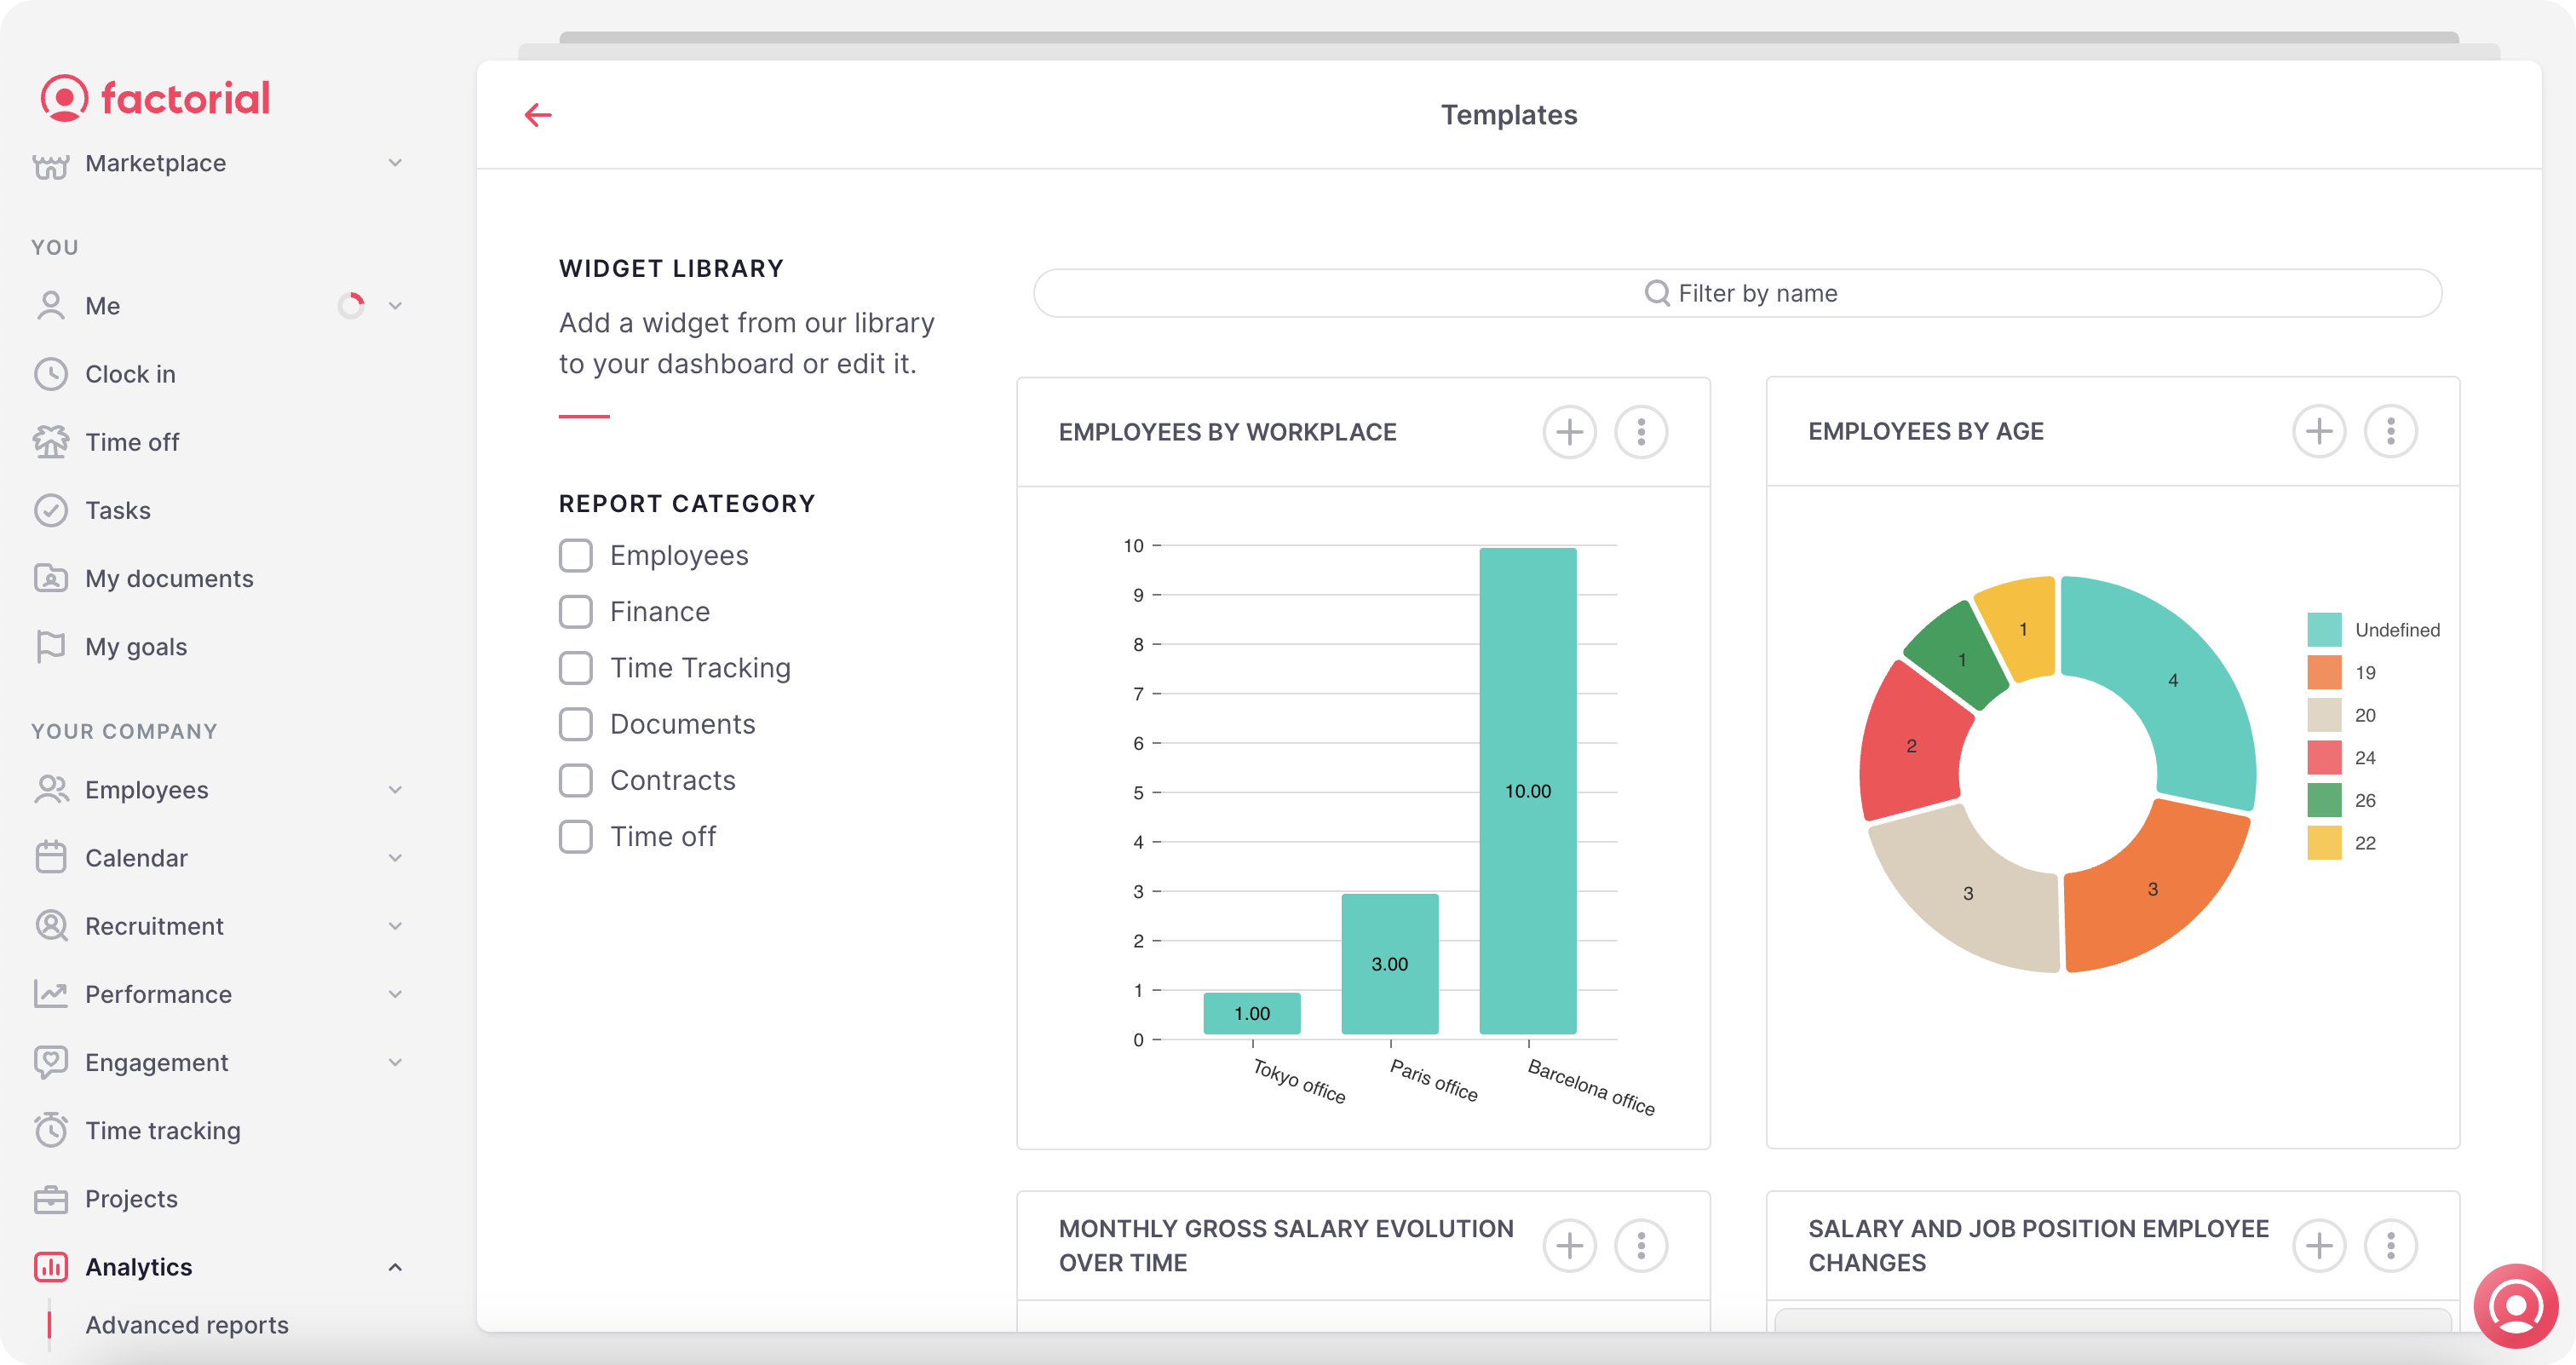
Factorial Reports
We revamped Factorial Reports to tackle declining usage and customer discontent. We reached a +300% uptick in custom report creation and a 12.7% usage increase. This revamp not only prevented critical churn cases but also aligned with our aim to reduce the churn rate related to Reports to less than 1% monthly.
We designed, built and launched an evolution of Factorial's Reporting tool to cover any need that may arise for our customers. Based on fully scalable and adaptable Business Intelligence, we built a new reporting engine that can calculate any type of operation. With the new engine, the new SQL Editor, and the new Dashboard Manager, we are able to take the use of reports to a whole new level.

1. Context
Factorial is the software that helps companies to manage everything that a company needs to manage in one centralized system; saving time, eliminating mistakes and helping companies to make decisions.
Reports is a key domain to help our customers to make better decisions based on real data about their workforce and their business.
What is a report?
A report is a visual representation of data or information.
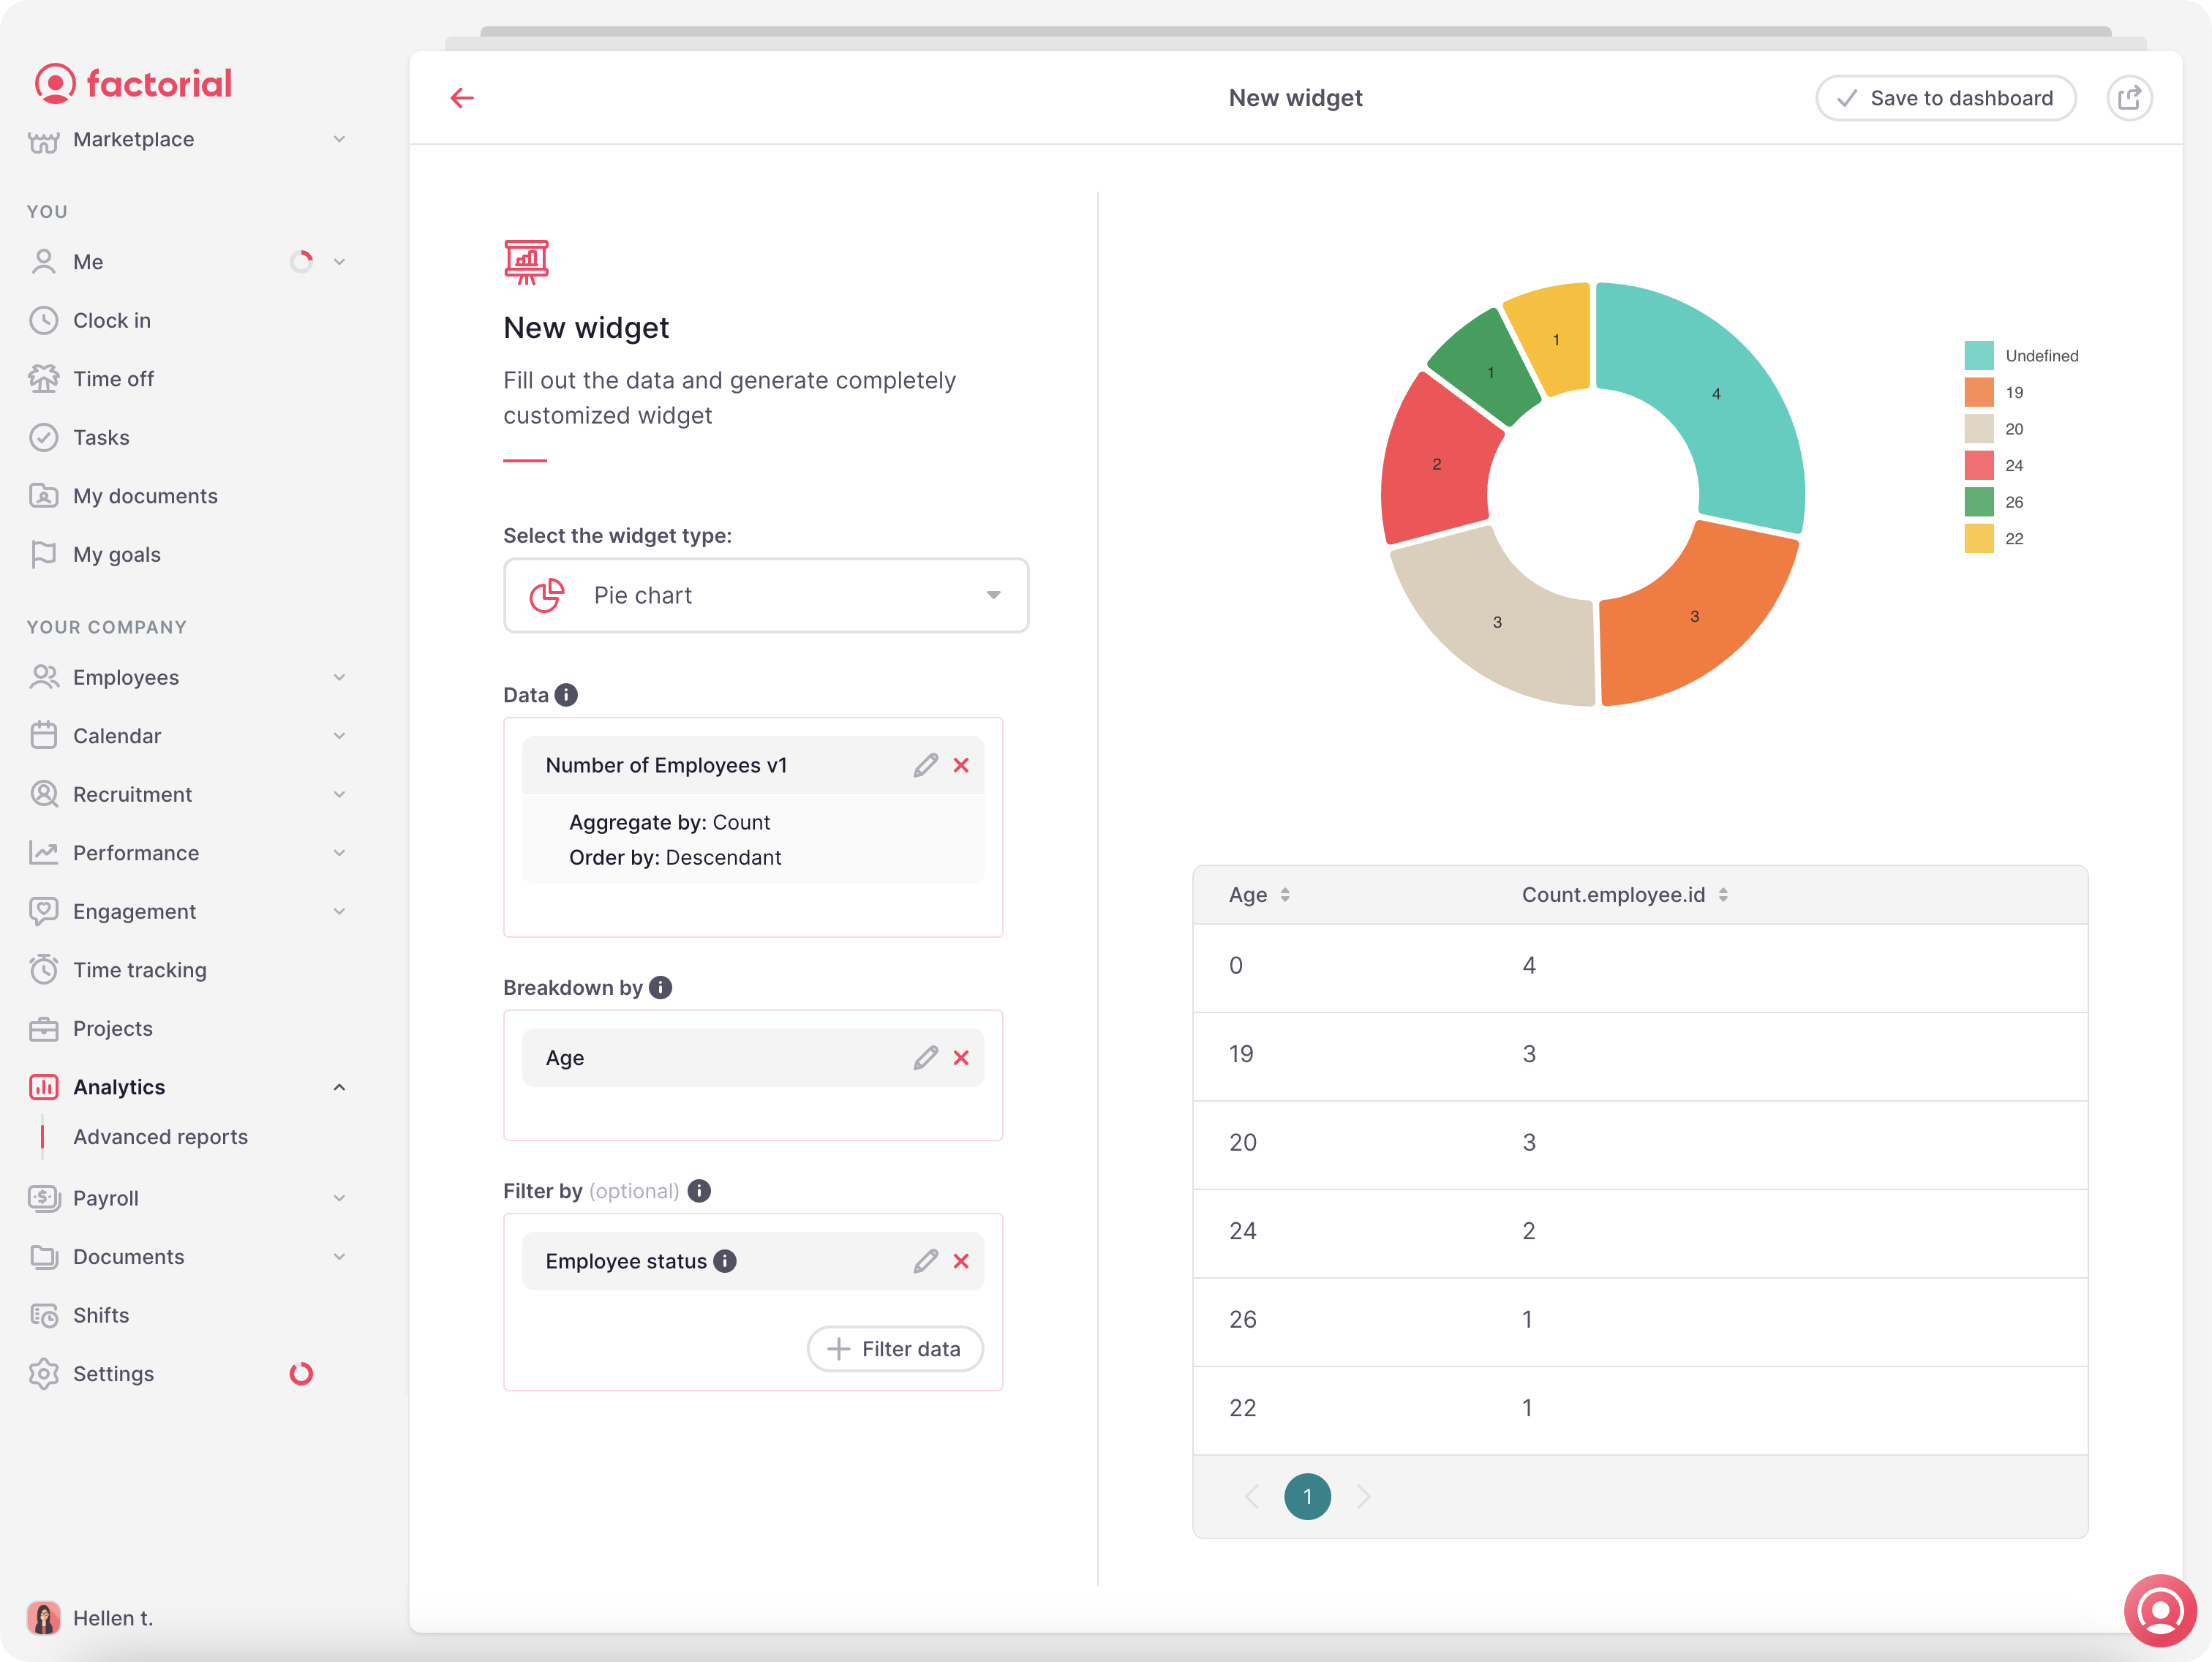
Our old reporting tool let customers create custom reports with a query builder or choose from pre-built reports. They just need to pick the data they want and cross them together. Admin level users can create reports with different visualizations, share them, and download them.
But many customers complained about this query-builder. And tickets, customer complaints and account manager requests were piling up in Hubspot and Canny.
2. Problem
The usage ratio of Reports is dropping and churn risk was going up and we were losing a lot of deals because of this tool. All metrics were absolutely negative.
So, at the end, our reporting tool was fulfilling the needs of our customers.
3. Discovery
We talked to several of our customers to understand their needs and the problems we couldn't solve. We conducted 30 interviews and online surveys with more than 200 customers. Our goal was to identify the needs, frustrations, and objectives of users related to reports.
Although our Reporting tool worked well for a while, our customers were becoming bigger and bigger. And they had new needs. We discovered and confirmed two major problems: Crossing two data points on a simple axis was not enough, and non-admin users (HR, Team leaders, Managers, etc.) were the new real users of Reports.
4. Definition of success
The success criteria for reports is to have all the pieces needed to easily add information to reports in a quick way so finally make it possible to include the reports data for any new feature in the same epic and also increase maintainability.
- Product metric: To get any reports needed in all the use cases listed above to be generated.
- UX metric: To create any report that could previously be generated in 75% less time.
- Technical metric: To create any back-end exposer needed from any domain in less than 2 hours.
5. Solution
Our new customers need a different way to use and consume their data, and their organization and structure are different, affecting how they want to use Reports. They want to create more complex reports and share them in a way that fits their organization.
So, we decided to evolve our Reporting tool to meet any customer need. With a new reporting engine, a SQL Editor, and a brand new Dashboard Manager, we can take the use of reports to a whole new level.
New engine
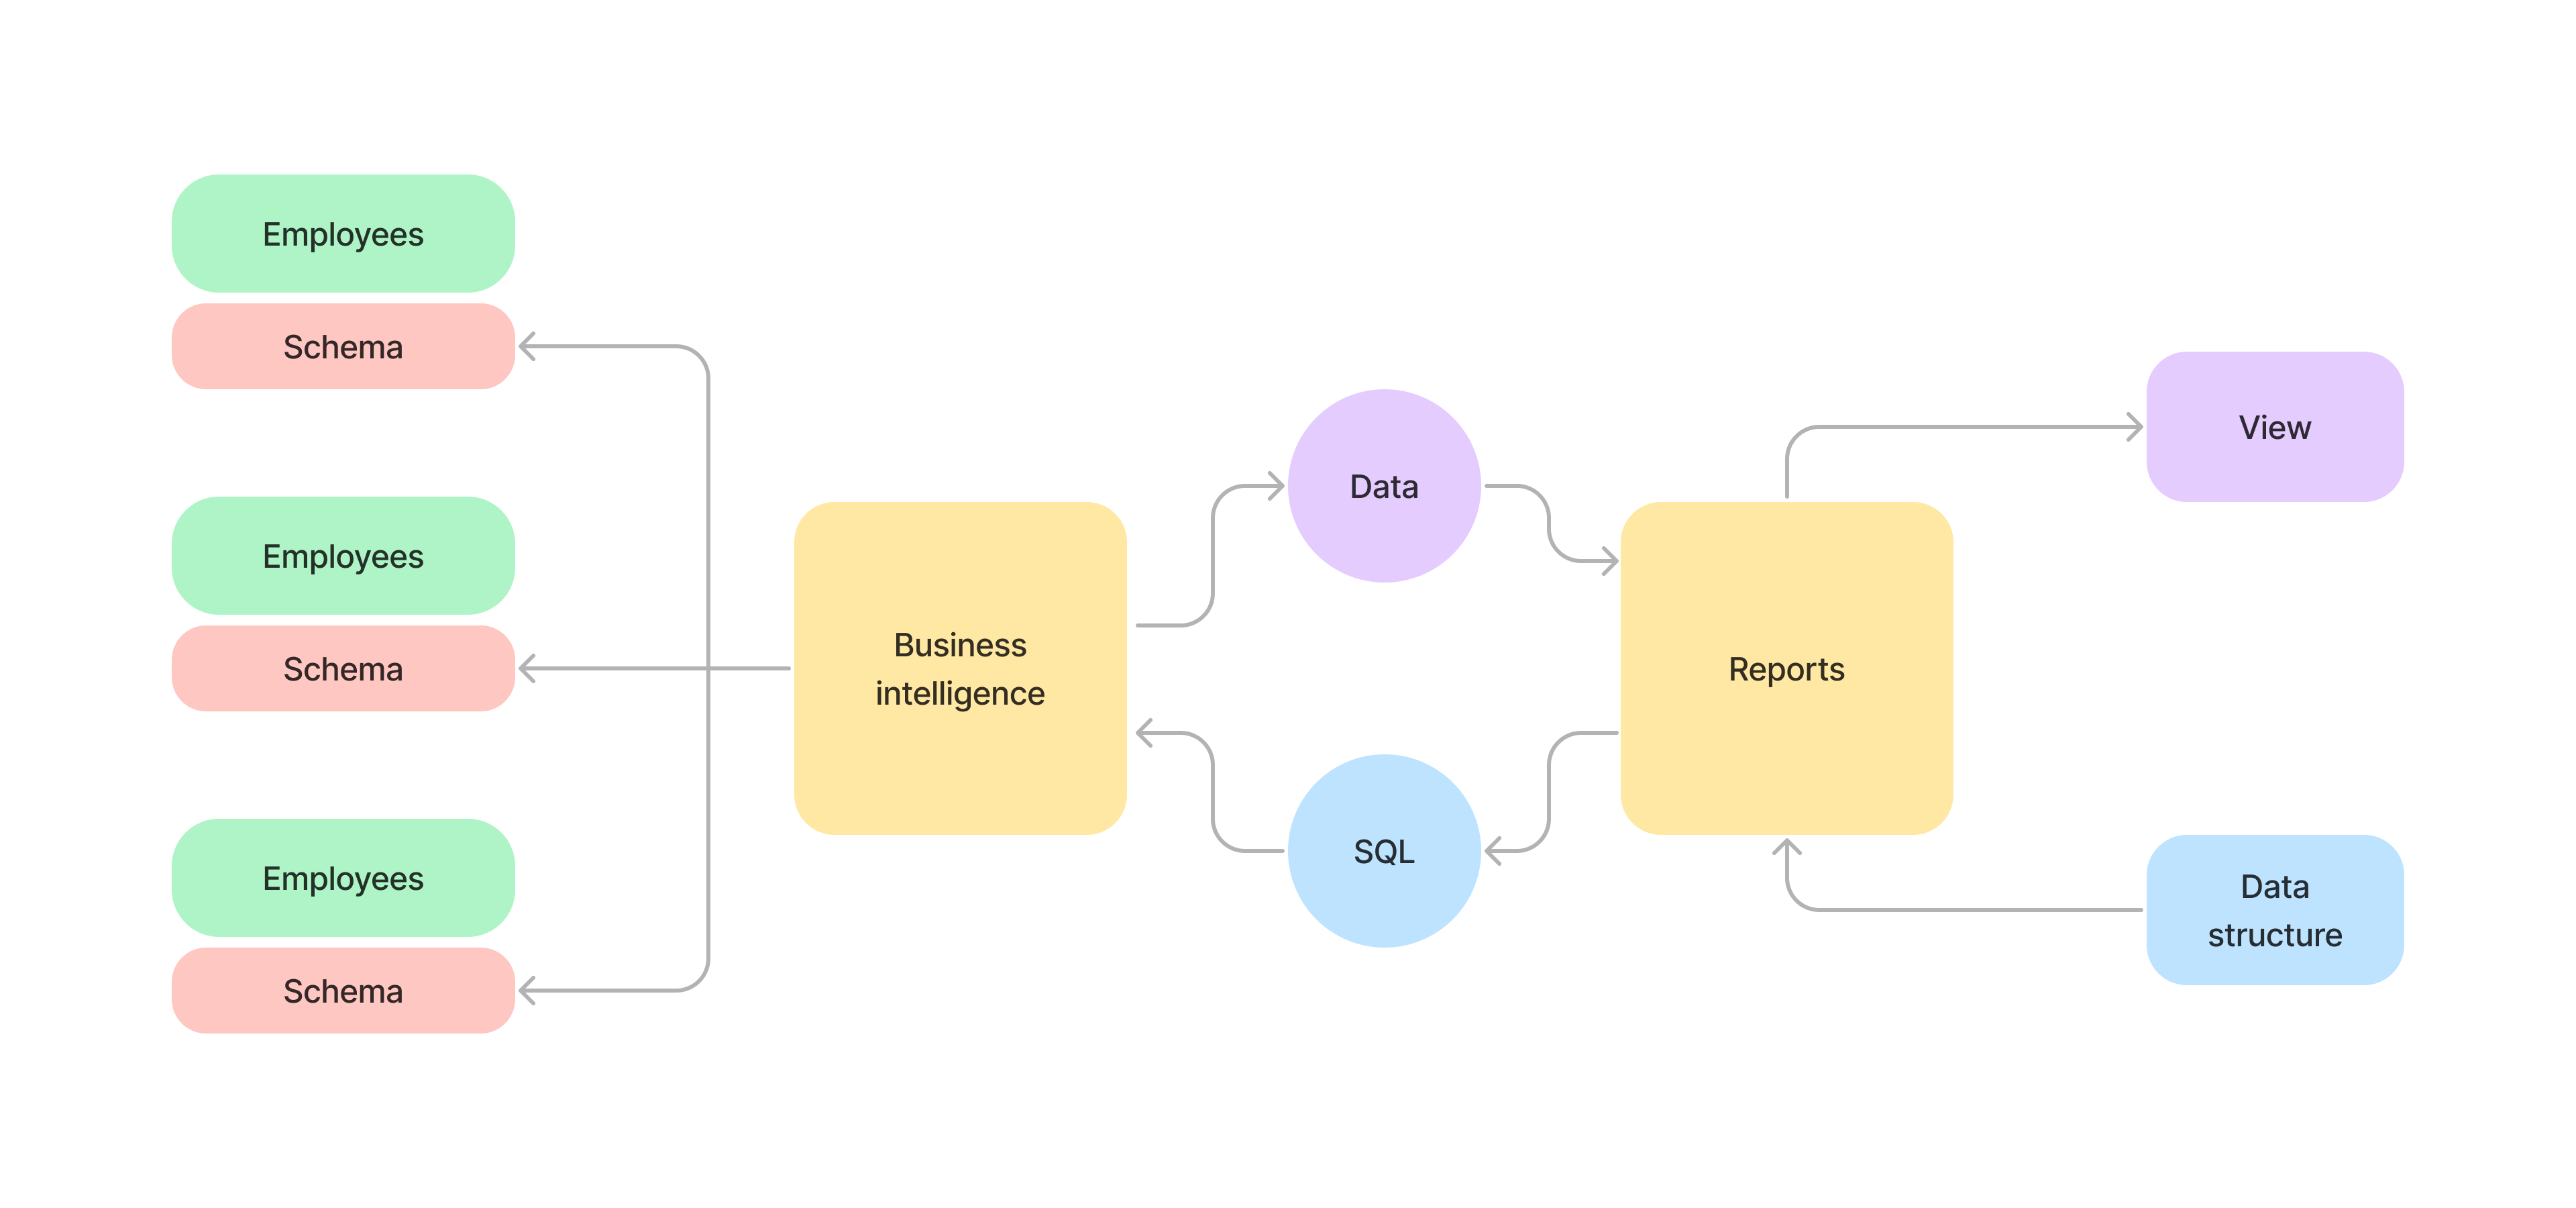
The new engine allows connecting all the data stored by the client in Factorial and cross-referencing tables to generate reports that were previously impossible, including on absences, timekeeping, recruitment, expenses, and performance.
SQL editor
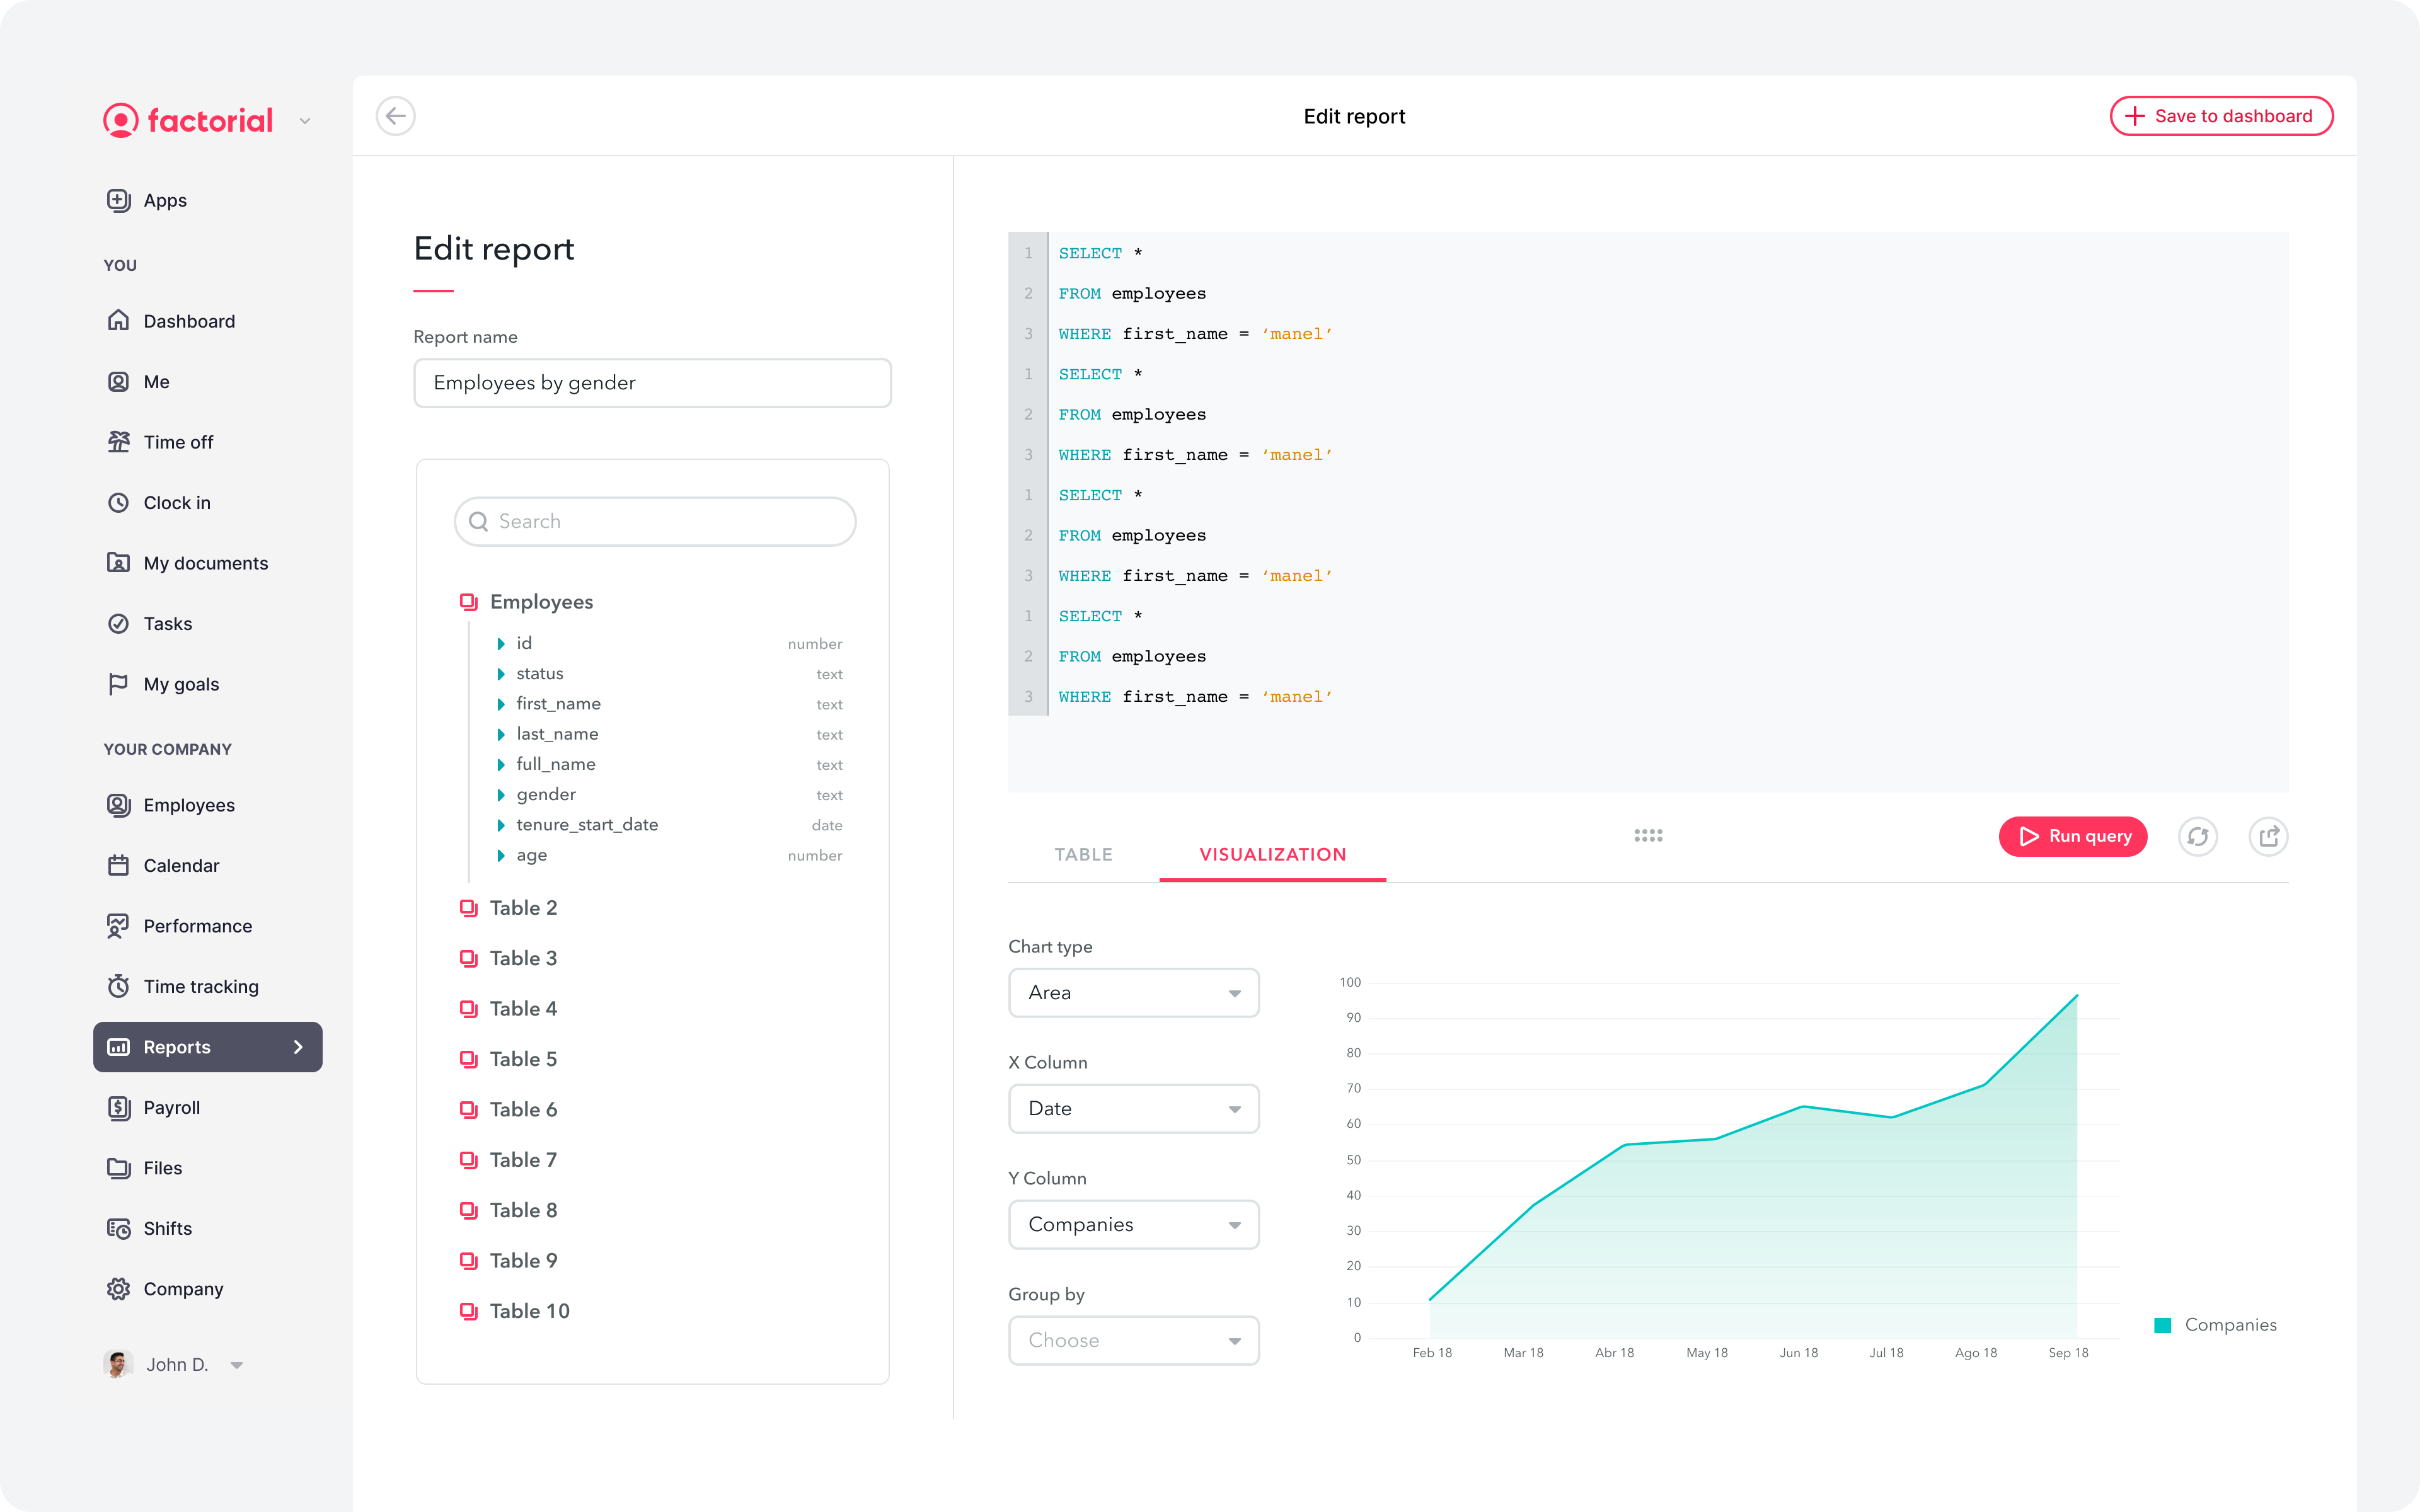
We concluded that using SQL was the best and most scalable way to leverage our datalake. With the new SQL Editor, clients can fully utilize all their data from Factorial, combining and analyzing it as they wish.
The SQL Editor addresses the limitations of the old report generator, allowing customers to cross tables and perform complex calculations. This lets them create reports that were previously impossible. Additionally, we can use it to build custom reports for clients at high risk of churn.
New dashboard manager
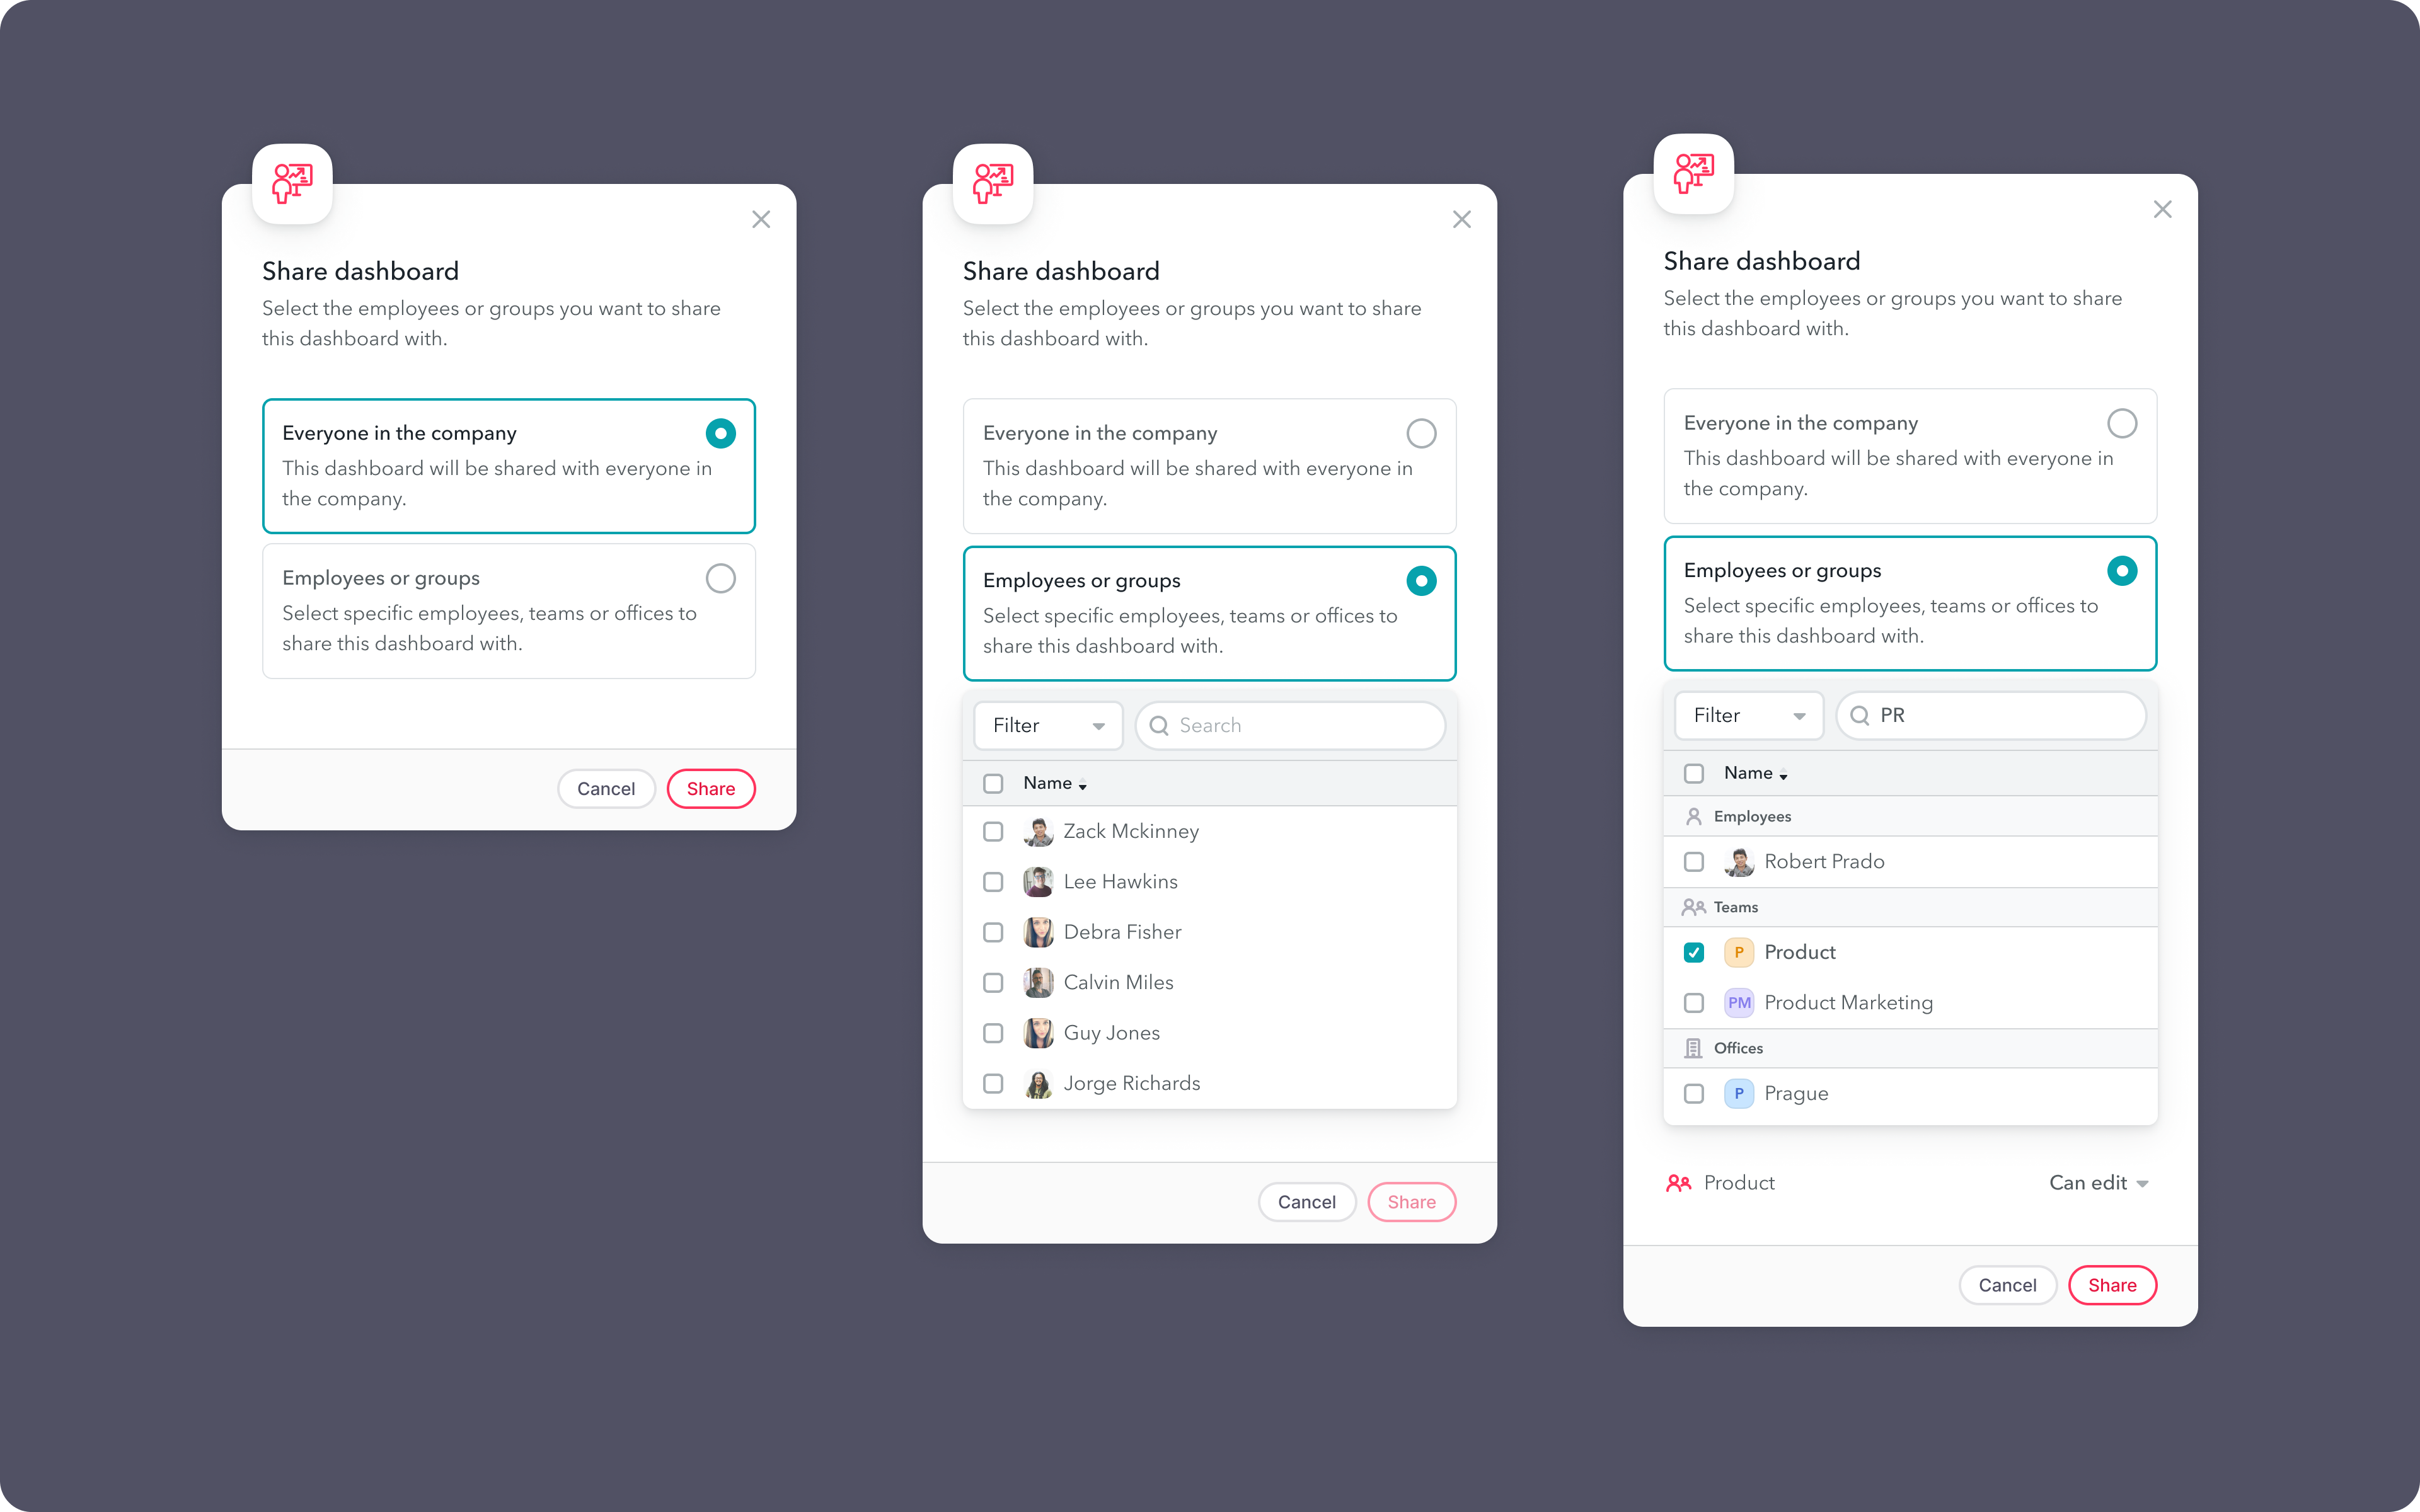
The new Dashboard Manager lets all employees (with the right permissions) create their own dashboards and reports, and share them with specific groups, such as teams or offices. This allows us to:
- Create team-specific dashboards and reports.
- Restrict view or editing access to certain employee groups.
- Mark dashboards as individual favorites for easier management.
6. Design challenges
Broad audience
One goal of this initiative was to make Reports accessible to all employees of our clients, from CEOs of large companies to individual team members with no reporting experience. We had to design reports for both complex needs and simple charts, catering to users with varying levels of technical knowledge.
Permissions and access management
Managing access and permissions was essential. Organizations need to control user access based on roles, while users should be able to manage who can view or edit their own reports and dashboards. We created a user interface that lets dashboard owners share freely, while still allowing administrators to assign or revoke permissions, keeping sensitive data secure and accessible only to authorized users.
Scalability and performance
Enterprise software needs to be scalable and high-performing. Organizations expect it to handle more data, users, and changing needs.
Designers should use modular design to ensure the software can grow and adapt without losing performance. This approach made creating new Reports smoother and better suited to complex organizational needs, providing a seamless user experience.
Consistency
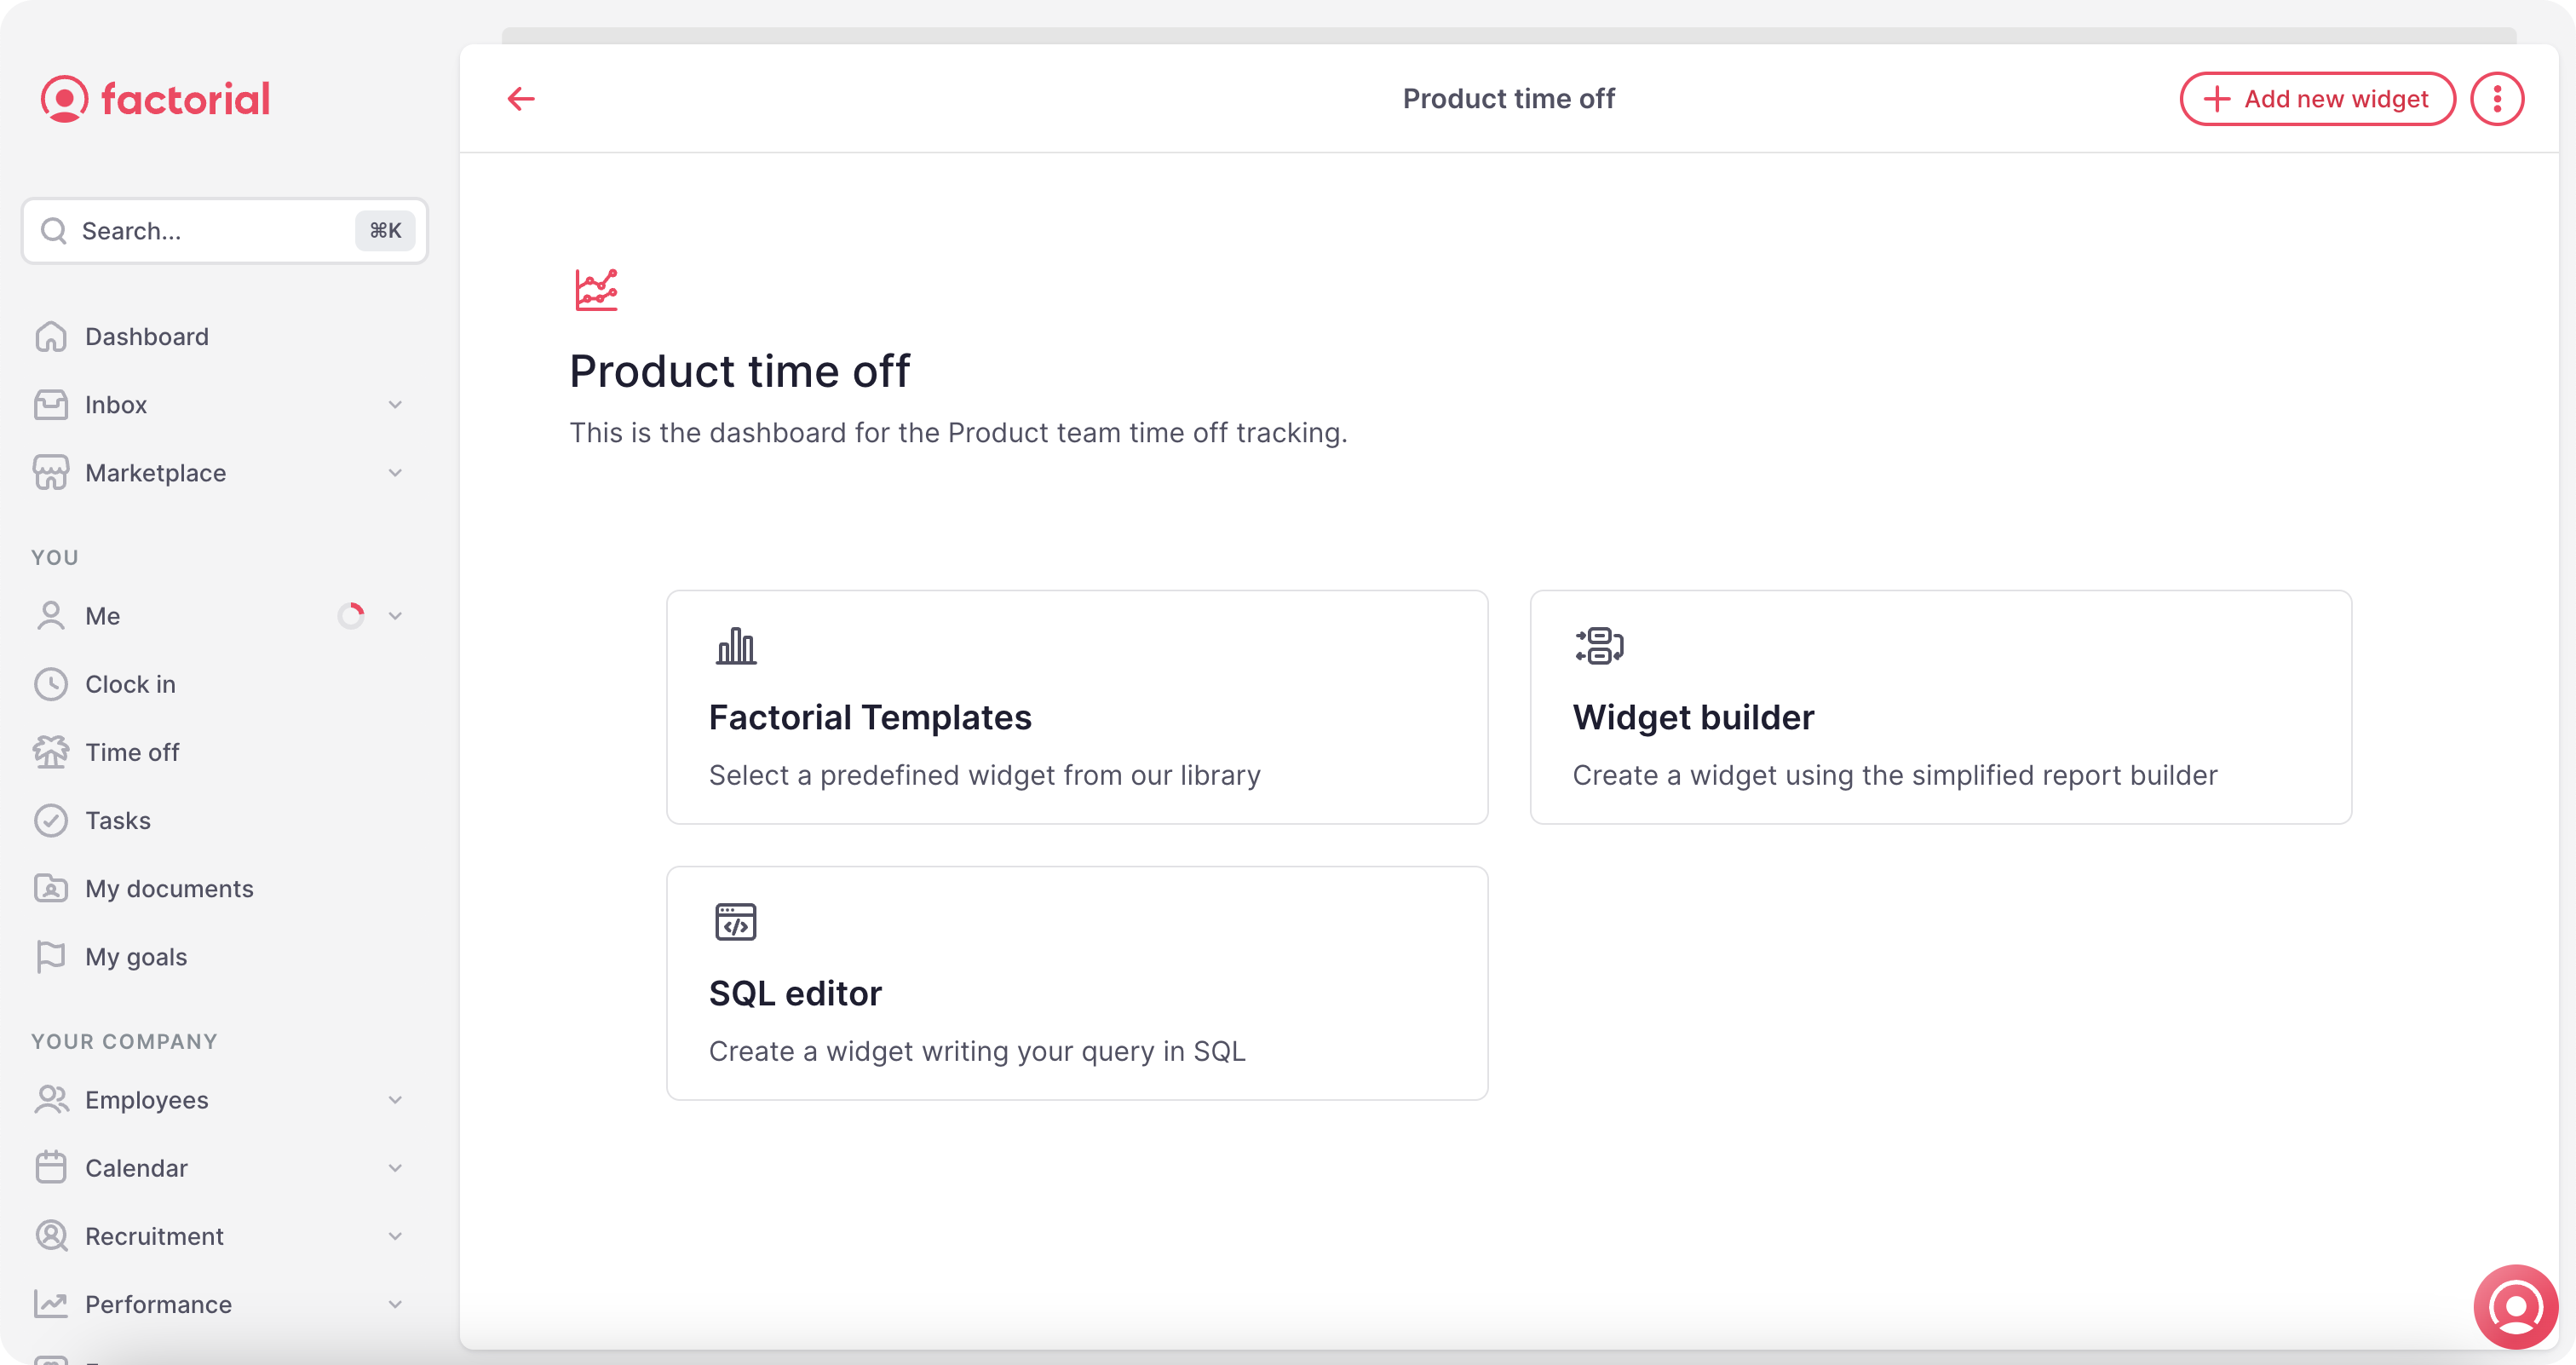
Reports were already in place before this update, so we had to ensure that the new interface and features fit well with the existing ones. For instance, integrating the SQL editor with previous tools like Templates and Widget builder was crucial.
This consistency helps users stay comfortable and navigate easily. We achieved this by applying our design system, patterns, and guidelines across the software.
7. Implementation
Validation
Once we had prototyped our solution we went back to talk to some customers we had talked to previously and we could validate that this way they would be able to generate those reports that right now were impossible to get out. The interface was familiar to SQL users, intuitive and maintained the basic querybuilder that hundreds of companies were still using. In addition, it was a tool that we could use ourselves to build custom reports for our clients in cases of severe churn risk.
Release
This feature was designed and developed in permanent contact with the developers of my team during 6 weeks. We made a soft release in which we opened the feature to 10 customers previously contacted for two weeks, who gave us periodical feedback. After that period of time, we opened the new feature to all our customers.
8. Outcome
With this feature we were able to increase custom report creation by 400%. The usage ratio increased in 12.7 points and we avoided very critical churn cases preventing a churn of 43.422 MRR in the next 3 months. It impacted on our main objetive for that quarter with a Key Result 01: Reduce the churn rate related to Reports to less than 1% monthly.
© 2024 Manel Abella
© 2024 Manel Abella

